Derivative Valuation, Risk Management, Volatility Trading

|
Investors have the option to invest in various assets. Among these, the most well-known are bonds and stocks. The reason behind their popularity is the balance between the risks and rewards they provide to investors. However, both are different from each other in their characteristics and the markets or brokers that contribute to them. What is a Bond Market?A bond market is also known as the credit or debt market. It refers to the market in which investors trade debt instruments, most prominently bonds, often issued by companies or governments. When investing in these instruments, investors take the role of a lender. They provide a loan to the issuer of the bond in exchange for subsequent interest and principal payments. The most prominent advantage of investing in the bond market for investors is that it provides a steady income source. In comparison to stock investments, the income from bonds may be lower. However, it also comes with lower risks for the investor. For government-issued bonds, such as Treasury bonds, the risks may be minimal. There are various reasons why investors prefer to include bonds in their portfolios. Most prominently, bonds allow them to diversify their portfolio. Similarly, investors prefer bonds in uncertain times, as it provides them with a fixed income with lower risks. Usually, risk-averse investors favour bond investments over other types of investments. Unlike most stock markets, bond markets don’t have a centralized location. Therefore, investors usually get bonds through a broker-dealer network. Most bond markets don’t have individual investors either. They include larger institutional investors instead. Some of these investors then further trade with individual investors. What is the Stock Market?A stock market is a market in which investors trade equity instruments, usually stocks. However, it may also include options and futures. By investing in the stock market, investors can buy shares for the ownership of corporations. As opposed to bond investments, stock investments may provide much higher returns, although they may come with higher risks. Stock markets are usually centralized locations that bring buyers and sellers together. They provide a regulated and controlled environment where investors can trade with each other or with companies. The transactions involved in the stock market are relatively more transparent and fairer. Therefore, it provides all investors with similar conditions in which they can trade. The reason why investors prefer to include stocks in their portfolios is that they provide better returns. Investors can not only benefit from steady dividend payments but also take advantage of capital gains. Similarly, stocks have a higher chance of increasing wealth to the holders compared to a bond's fixed-income returns. What are the differences between a Bond and Stock Market?As mentioned, the primary difference between the two types of markets is their location. While bond markets are decentralized, stock markets have a centralized location. Similarly, both vary due to the risks involved in investing in their underlying instruments. Likewise, the rewards that investors get from each type of instrument in these markets also differ. ConclusionBond markets are locations where investors can trade debt instruments. On the other hand, stock markets are for equity investments. Investors can use both markets to create a diversified portfolio. However, there are some differences between the markets and their underlying instruments, as discussed above. Originally Published Here: Bond Market vs Stock Market
0 Comments
What is a Market Index?A market index is a portfolio of securities that represent a segment of the stock market. These securities come with specific characteristics and are a part of a particular stock market index. The value of the index comprises the price of the underlying holdings. However, a market index isn't a real portfolio but rather a hypothetical one. The most well-known stock indexes in the US market are the S&P 500, Nasdaq Composite, and Down Jones Industrial Average. These represent a collection of stocks from various companies valued based on specific characteristics. Investors can’t directly invest in these indexes, though. However, they can invest in index funds that use these indexes as a benchmark. How does a Market Index work?As mentioned, a market index represents a segment of the financial market. Therefore, it measures the value of a portfolio holding that has a specific market characteristic. There are several methodologies used to calculate the value of an index, maintained by the index's provider. Most market indexes use a price or market-cap based methodology. Investors use market indexes to follow the financial markets and manage their portfolios. Similarly, most funds, such as index funds or exchange-traded funds, use indexes as benchmarks to compare performance. Therefore, market indexes play a critical role in the investment management business. How is the value of a market index calculated?There are various market index methodologies used to calculate the value of an index. The value of the index comes from the weighted average calculation of the values of the total portfolio. There are various bases for valuing an index, for example, market-cap weighting, float-weighting, fundamental-weighting, and revenue weighting. Based on the basis used for valuing an index, an index's value will change with a change in that value for its underlying stock. For instance, the value of a market-cap weighted index will change if the market capitalization of the underlying stocks changes. As the value of an index depends on weighting several stocks, the largest stocks will influence the index's value, more than the smallest ones. What are the uses for Market Indexes?Market indexes have several uses or functions. Firstly, investors and portfolio managers can use market indexes as benchmarks. It is especially true when they perform performance comparisons and making decisions related to investments. Similarly, some funds, such as mutual or index funds, use market indexes as a benchmark. Market indexes are also commonly used as a method of investing in stocks with similar characteristics. For example, investors usually invest in high-growth potential emerging sectors using market indexes. The use of market indexes also depends on the type of index and its basis. Lastly, investors can also use market indexes when devising a diversification strategy. Investing in indexes help investors to diversify their portfolio as compared to investing in individual stocks. Similarly, investors can invest in multiple indexes to even further diversify their portfolios. Index investing companies with higher returns but at the same time, lower risks. ConclusionA market index represents a hypothetical portfolio of securities that come from a segment of the stock market. The underlying securities within a market index come with specific characteristics. There are multiple methodologies for valuing market indexes. Post Source Here: What is a Market Index When it comes to implementing an investment portfolio, there are two crucial strategies that investors can use. These are asset allocation and diversification. Both of these strategies correlate the risks taken by investors in their portfolio for their given risk tolerance. Similarly, investors can limit their exposure due to risk due to concentrating all their investments in one asset using these strategies. Investors need to differentiate between these strategies to understand them better. What is Asset Allocation?Asset allocation helps investors balance their risks and reward by apportioning a portfolio's assets according to various factors. In other words, asset allocation refers to the strategy in which investors divide their investment portfolio between several diverse asset classes to minimize the risks associated with their investment. There are three primary asset classes from which investors can choose, equities, fixed-income, and cash and equivalents. When considering an asset allocation strategy, investors must consider various factors, as stated. Firstly, investors must consider their goals, which will dictate the risks and rewards they expect. Similarly, they must also regard their risk tolerance level. Lastly, investors also need to consider the time horizon of their investments. Most experts suggest that investors must reduce their level of volatility of portfolios. Therefore, investors need to diversify their investment into various asset classes. Since every asset class has its own associated risks and rewards, the investors will achieve a diversified portfolio. Similarly, by investing in several asset classes, they can guard against any unforeseen circumstances in a better way. The idea behind asset allocation is that when investors include various asset classes in their portfolio, a downturn in one asset class will not affect them in the same manner as if they had invested in a single class. By using asset allocation, investors can get compensated for the downfall of one asset class with an upturn in another one. What is Diversification?Portfolio diversification isn’t a new topic in the world of investing. It refers to the process in which investors include a wide variety of investments within their portfolio. The goal of diversification is to minimize the unsystematic risk of an investment. Therefore, the negative performance of one investment cannot affect the investors' whole portfolio. Diversification is different from asset allocation. With asset allocation, investors include investments from different asset classes in their portfolio. On the other hand, diversification applies to a single asset class. Therefore, if an investor buys only stocks of various companies or industries, they employ the diversification strategy, not asset allocation. However, by diversification, investors cannot guarantee against a loss. Diversification helps in reaching a long-term financial goal while also minimizing risks. The idea behind diversification is that by having various stocks from several sources, investors don't have to suffer due to an unforeseen event that can affect a specific investment or industry. However, that doesn't mean they can protect their portfolio against events that affect the market as a whole. For that, they must use asset allocation. ConclusionAsset allocation and diversification are two strategies that investors use to manage their portfolios. While both are a crucial part of investing, there are some differences between both. Given above is a detailed analysis of what they are and how investors can use them in their portfolio management. Article Source Here: Asset Allocation and Diversification What is a Monte Carlo Simulation?A Monte Carlo simulation refers to a technique used in financial modeling to determine the probability of various outcomes in a process or problem that is not easily predictable or solvable. The reason behind the difficulty of the process or problem is the existence of random variables. A Monte Carlo Simulation produces a simulation based on random samples to achieve numerical results. While there are various ways to perform Monte Carlo simulations, the easiest way is through Excel. There are various built-in tools in Excel that help with the simulation. The most common tool used in this regard is the "What-If Analysis" tool. Monte Carlo Simulation in ExcelA company wants to calculate its profits for a project based on estimations. However, there is some uncertainty around the estimates. Therefore, the company performs Monte Carlo simulations. It has the following information available.
The company assumes there is a normal distribution around these inputs. Therefore, it can perform the simulation using Excel. The first step to perform Monte Carlo simulations is to calculate the normal distribution for the figures above. The company may use the following formula to calculate a normal distribution for all these. NORM.INV(probability, mean, standard deviation) For the first parameter, the company uses a random probability using the ‘rand()' function. For the mean parameter, the company uses the expected results. Based on these, the company gets the following outputs.
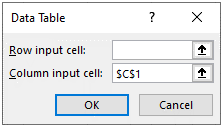
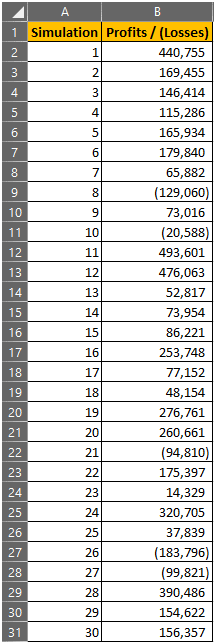
The company's expected profits, based on the first simulation, will be $341,956. The next step the company takes is to make a table for the number of simulations it wants to make. For this purpose, the company wants to generate 30 simulations. Once it creates a table for the 30 simulations, the company links the profits to the table, from the first simulation. For the other 29 simulations, it uses the What-if Analysis Data Table feature. The tool needs at least one input cell for random calculations. However, the cell should be a cell outside the table. Here's how it looks.
Based on the calculation, it produces the following table.
Based on these simulations, the company performs several other calculations, such as calculating the mean value, which comes to $139,246. The formula it uses is “=AVERAGE(B2:B31)". Similarly, the company measures the standard deviation for the simulations using the formula "=STDEV(B2:B31)”, which comes to $171,670. Therefore, using excel can help in performing Monte Carlo simulations when there is uncertainty involved in variables. While the above example considers only 30 simulations, users can choose to generate even more simulations based on their needs. Similarly, the company used the simulation to calculate the average and standard deviation of the outcomes. However, users may use the simulation in more complex ways than that above. ConclusionMonte Carlo simulation is a technique used to determine the probability of various outcomes for complex processes in the presence of random variables. While several tools can perform simulations, the most commonly used one is Excel. The Excel feature that helps with Monte Carlo simulations is the What-if Analysis Data Table tool combined with the “NORM.INV” formula. Article Source Here: Monte Carlo Simulation in Excel When it comes to investing strategies and managing their portfolios, investors have two main options. They can either use an active or passive management strategy. Both of these strategies have their advantages and disadvantages. However, investors must choose their own tactics that suit them. To know which option is the best for them, investors need to understand what they are and how they can use it to their benefit. What is Active Management?Active management refers to the trading strategy in which investors actively manage their portfolios. Investors using this management strategy buy and sell stocks in order to outperform a specific index, such as the S&P 500 or the market as a whole. Usually, a portfolio manager takes care of the actively managed stocks under this strategy. Whether investors succeed or fail in this strategy depends on how much research they have performed and the techniques they use. Investors can combine various models and methods to identify stocks that they believe will help them outperform the market. With this management strategy, investors need to identify any opportunities and exploit them readily. Usually, investors using this investing strategy follow market trends, changes in the political landscape, shifts in economics, legal factors, one-off events, etc. These are the factors that can affect the performance of a specific stock in the market. Based on this research and the data collected in this step, investors can select stocks that they believe are undervalued and may result in profits. As mentioned, the goal of this strategy is to identify investments that can outperform the market. Therefore, investors will look for the highest possible returns. However, that also means that they will have to bear higher risks compared to other strategies. What is Passive Management?Passive management is the opposite strategy for active management, sometimes also referred to as index fund management. In this strategy, investors don't actively manage their portfolio but rather take a passive approach. The goal of this strategy isn't to beat the market but to imitate a particular market index's returns. Therefore, the purpose of stocks included in a passive portfolio is to generate returns similar to a chosen index. Usually, passive management doesn't require active portfolio managers. Investors using the passive management strategy often prefer investing in mutual funds, index funds, or exchange-traded funds, all of which achieve the goal. A passive mode of investment is much more inexpensive in comparison, as it does not require proactive management of portfolios. Therefore, the management fees associated with this strategy are minimal. In comparison, active management costs more. However, passive management comes with a downside of lower returns, although it also comes with lower risks. Which is better, Active Management or Passive Management?Both types of portfolio management strategies have their advantages and disadvantages. However, it is for investors to decide which one they want to use. Usually, investors consider various factors before choosing a strategy, among which the most critical are time and costs. However, that does not mean investors can't use a combination of both for the best results if they want. ConclusionThere are two portfolio management strategies that investors can use, active or passive. Active management, as the name suggests, requires proactive portfolio management. On the other hand, the passive mode approach is the opposite. Post Source Here: Passive Management vs Active Management What is Hypothesis Testing?Hypothesis testing is a concept in statistics in which analysts test an assumption regarding a population parameter. It is a method used in statistical inference. The use of hypothesis testing is useful when determining if a statement regarding a population parameter is statistically significant. Overall, it is a critical part of the scientific method, which represents a systematic approach to assessing theories through observation. Through hypothesis testing, one can assess the plausibility of a hypothesis by using sample data. This data can come from various sources, such as a large population or a process that generates data. Similarly, the hypothesis can come from any judgment used by the user that is achievable. Hypothesis testing is also a great tool for evaluating various scenarios. How does Hypothesis Testing work?In hypothesis testing, analysts test a statistical sample to provide evidence on the plausibility of the null hypothesis. To perform hypothesis testing, analysts test a hypothesis by measuring and examining a random sample of the population. They use a random population sample to evaluate two different hypotheses, the null hypothesis, and the alternative hypothesis. The formula for the null hypothesis is as follows. H0: µ0 = 0 Similarly, the formula for the alternative hypothesis is as follows. Ha = µ0 ≠ 0 The null hypothesis represents a hypothesis of equality between population parameters. For example, a null hypothesis may state that the population mean return is equal to zero. On the other hand, the alternative hypothesis is the opposite of the null hypothesis, which tests whether the population mean return is not equal to zero. How to perform Hypothesis Testing?Hypothesis testing is a several step process. The process starts with analysts stating the null (H0) and the alternative hypothesis (Ha). After that, they consider the statistical assumptions and whether these assumptions are in line with the underlying population in evaluation. After that, analysts determine the appropriate probability distribution and select the appropriate test statistic. Then, analysts can select the significance level, which is the probability threshold for which they will reject the null hypothesis. Based on the significance level they use and the appropriate test, they must also state the decision rule. From the testing, they can collect the data observed and use it to calculate the test statistic. After that, analysts should either reject the null hypothesis or fail to reject it based on the results obtained. The process is called a statistical decision. They must also consider any other economic issues that may apply to the problem. These are non-statistical considerations that they must consider for a decision in addition to the statistical decision for a final decision. As mentioned, hypothesis testing has two parts, the null hypothesis, and the alternative hypothesis. Analysts try to reject the null hypothesis. That is because the alternative hypothesis is often difficult to prove. So, if the null hypothesis is false, then the remaining alternative theory gets accepted. ConclusionHypothesis testing is a method in which analysts test an assumption about a population parameter. There are two parts to hypothesis testing, testing the null and alternative hypotheses. Performing hypothesis is crucial and consists of several steps, as stated above. Article Source Here: Hypothesis Testing in Statistics What is Confidence Interval?The confidence interval, in statistics, represents an estimate of an interval that may consist of a population parameter. In other words, it refers to the probability of a population parameter falling between a set of values for a particular proportion of times. A confidence level is a term often associated with sampling because it helps calculate the degree of uncertainty or certainty in a specific sampling method. There are two limits to the interval which define it. The confidence interval comes in the form of a percentage, which has an upper and lower bound. These percentages reflect the confidence level. What is Confidence Level?Confidence level refers to the percentage of probability or certainty that the confidence interval consists of the true population parameter when a random sample gets drawn many times. A confidence level of 0% shows that there is no certainty that the sample includes a true population parameter and, therefore, will draw a different sample each time. A confidence level of 100%, on the other hand, shows that no matter how many times the simple get drawn again, it will result in the same selection. How to calculate the Confidence Interval?It is necessary to determine the criteria for testing first to calculate the confidence interval. The confidence interval varies based on the chosen criteria. Next, it is crucial to select a sample from a given population. The sample helps in testing or performing the hypothesis. Next, it is necessary to determine the mean and standard deviation for the sample chosen. From the given data, it is straightforward to calculate a confidence level. It may range from 90% up to 99%. After calculating the confidence interval, it is also possible to calculate the confidence coefficient for the confidence interval chosen. The calculation of the confidence coefficient is straightforward using z-tables. Finally, it is also possible to determine the margin of error for the estimation. By using the above information, the confidence interval for the chosen sample with the confidence level becomes determinable. The formula to calculate the confidence interval is as below. Confidence level = Mean of sample ± Critical Factor x Standard deviation of the sample How to interpret the Confidence Interval?Most users of the confidence interval often misinterpret or misuse it. Even most professionals or scientists don't interpret it correctly. For example, a 99% confidence level does not imply that for a given realized interval, the probability that the population parameter lies within the interval is 99%. In fact, for any confidence level, users tend to misinterpret it as the probability of population parameter lying within the interval. It is one of the most common misconceptions involving confidence level. After calculating the confidence interval, there is no longer a probability of covering the confidence level. It either includes the parameter value, or it doesn't. That is why the confidence interval varies for various samples while the true population parameter doesn't, regardless of the selected sample. ConclusionConfidence interval is a term used to represent the estimate of an interval that consists of a population parameter. It is a term closely related to the confidence level, which refers to the percentage of probability or certainty that the confidence interval consists of the true population parameter. Post Source Here: Confidence Interval in Statistics Previously, we elaborated on why hedging is an important tool for risk management. We illustrated the importance of hedging with examples from the commodity, mortgage back securities, and foreign exchange markets. A recent paper [1] evaluated the hedging effectiveness of various range-based volatility estimators. Among them, we can find the commonly used GARCH model. Generalized AutoRegressive Conditional Heteroskedasticity (GARCH) is a statistical model used in analyzing time-series data where the variance error is believed to be serially autocorrelated. GARCH models assume that the variance of the error term follows an autoregressive moving average process. Although Generalized AutoRegressive Conditional Heteroskedasticity (GARCH) models can be used in the analysis of a number of different types of financial data, such as macroeconomic data, financial institutions typically use them to estimate the volatility of returns for stocks, bonds, and market indices. They use the resulting information to help determine pricing and judge which assets will potentially provide higher returns, as well as to forecast the returns of current investments to help in their asset allocation, hedging, risk management, and portfolio optimization decisions. Read more The article concluded, The study is based on weekly data from January 2000 to December 2016 for six markets, including crude oil, gold, silver, natural gas, S&P 500, and NIFTY 50. The performance of hedge ratios estimated with various methods is evaluated with variance and semi-variance as the measures. The empirical results indicate that there is no specific econometric method, which outperforms the others consistently and significantly. The rolling OLS and BEKK GARCH methods are more efficient for estimating the optimal hedge ratio as compared to the other methods. The hedge ratios estimated with range-based models are not as efficient as those estimated with returns-based models are. More importantly, there is no significant difference in the variance/semi-variance of the naïve or rolling OLS based portfolios when compared to the other best-performing portfolios. The results are in line with some previous studies, which suggested that the simple naïve and OLS methods perform as well as the other more complex and sophisticated methods, if not better than them. The range-based methods are no exception to these general findings. Briefly, simple hedging methods work as well as other more complex and sophisticated ones.
References [1] V. Pandy, V. Vipul, Hedging performance of range-based volatility estimators, Journal of Business and Economic Studies, 2020 Article Source Here: Hedging Market Risks Using Volatility Estimators-Are Sophisticated Methods Better? What is Monte Carlo Simulation?Monte Carlo Simulation is a method from statistics used in financial modeling used to determine the probability of various outcomes in a process or problem that is not easily predictable or solvable because of the existence of random variables. The simulation produced by this model depends on random samples to achieve numerical results. Monte Carlo simulation can help investors understand the effect of uncertainty and randomness in forecasting models. Similarly, it helps them determine the impact of risk and uncertainty in their modeling or forecasting. The model works by assigning multiple values to random or uncertain variables in order to achieve various results. From these results, investors can calculate an average to obtain an estimate. The model also has application in various other fields of life, including finance, investing, engineering, science, etc. Another name used to describe it is multiple probability simulation. In finance and other fields related to it, the Monte Carlo simulation assumes a perfectly efficient market. How does Monte Carlo Simulation work?Monte Carlo simulation suggests that one cannot calculate or determine the probability of varying outcomes due to the interference of random variables. Therefore, the simulation focuses on constantly repeating random samples to achieve specific results. The basis for it is that it takes variables with uncertainty and assigns a random value to them. Using that as a basis, the model runs and provides results. The model then repeats calculating and providing outcomes several times while assigning the variable with multiple values. At the end of the simulation, all the results will have different values. To obtain an estimate from those results, users must average them. How does Monte Carlo Simulation help in finance and investing?The Monte Carlo simulation has various applications in the finance sector and for investors. Firstly, investors can use it to evaluate or weigh different investments. Most commonly, they use it in equity options pricing. It can help investors estimate the current value of an option by simulating different paths for the price. Monte Carlo Simulation can also help investors in portfolio valuation. Any factors that can play a role in the valuation of a portfolio get simulated, which helps in the calculation of portfolio value. After that, investors can find the average value of all the simulated portfolios to get a final portfolio value. It can also help in financial modeling, as stated above. Lastly, the Monte Carlo simulation helps in the valuation of fixed income instruments and interest rate derivatives. The primary source of uncertainty for those instruments or derivatives is the short rate. The simulation helps assign a number to the short rate and simulate results to obtain the price of a bond or derivative for each rate. In the end, it helps in evaluating them by calculating an average of the obtained results. What are the limitations of Monte Carlo Simulation?Monte Carlo simulation has various limitations. Firstly, it does not provide exact results but rather statistical estimates of results. Similarly, the simulation is complex and may require costly software specially designed to carry out the complex simulations. Lastly, due to its complexity, the process of simulation may cause various errors which can produce inaccurate results. ConclusionMonte Carlo Simulation is a method used to determine the probability of various outcomes in an unpredictable or unsolvable problem because of uncertain variables. The model is complex but can help in finance and investing, such as financial modeling, evaluating investments, portfolio valuation, etc. Post Source Here: What is Monte Carlo Simulation Variance and standard deviation are two fundamental concepts in mathematics that have a vital application in the worlds of finance, economics, investing, and accounting. In investing, investors use these to devise a plan for their investments. It can help them build an attractive portfolio by developing an effective trading strategy. What is Variance?The variance relates to the mean, which is the average of a group of numbers. The term variance gives a measure of the average degree to which numbers within a set differ from the mean. Furthermore, the extent of the variance correlates to the size of the overall range of numbers. It means the more spread the range of numbers in a set are, the greater the variance is as well. On the other hand, the variance for a narrower range of numbers will be less. Mathematically, the variance refers to the average of the squared differences from the mean. When users want to calculate it, they must calculate the mean of a set of numbers. After establishing the mean, they must calculate the difference between each element in the set and the calculated mean. Lastly, they need to square and average the results. What is Standard Deviation?Standard deviation is a statistic that gives a measure of how far a group of numbers is from the mean. The standard deviation, mathematically, is the square root of the variance. To calculate variance, users need to use squares because it gives more importance to outliers than any data that is closer to the mean. The calculation allows for the difference about the mean from canceling out those below, which may result in zero variance. The calculation of standard deviation requires calculating the variation between each value in a set relative to the mean. If the difference between a number and the mean is high, there is a higher deviation. Similarly, if the difference is low, there is a lower deviation. Therefore, for a set that has a spread group of numbers, the standard deviation will be higher. Therefore, to calculate standard deviation, users need to add up all the data points first and divide them by the number of data points. In other words, they need to calculate the average for the set of data points. Then, they need to calculate the variance for each data point. Lastly, they can square root the variance to get the standard deviation. How do Variance and Standard Deviation help in investing?Both variance and standard deviation have significant importance for investors. They are crucial when investors want to calculate the security and market volatility of a stock. By identifying or calculating these, investors can develop an effective and profitable trading strategy and diversify their portfolios. Standard deviation also helps investors measure the risk associated with an investment. When the group of numbers in the considered set are close to the mean, it represents a less risky investment. In other words, a low standard deviation represents a lower risk investment as compared to a high standard deviation. However, high-risk investments may indicate better returns. ConclusionVariance and standard deviation are concepts used in mathematics that have a paramount significance in the world of finance and investing, among others. The term variance represents the measure of the average degree to which numbers within a set vary from the mean. On the other hand, the standard deviation shows how far a group of numbers with a set are from its mean. Originally Published Here: Variance and Standard Deviation |
Archives
April 2023
|
 RSS Feed
