Derivative Valuation, Risk Management, Volatility Trading

|
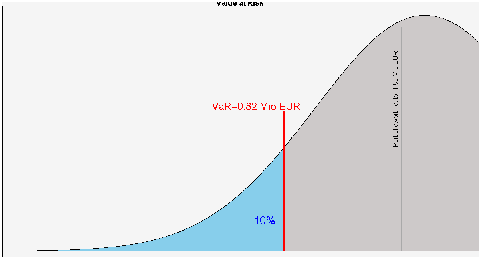
Value at Risk (VaR) is an important risk measure that large financial institutions use for managing the risks and allocating capital. Wikipedia defines VaR as follows: Value at Risk (VaR) is a measure of the risk of investments. It estimates how much a set of investments might lose, given normal market conditions, in a set time period such as a day. VaR is typically used by firms and regulators in the financial industry to gauge the amount of assets needed to cover possible losses. For a given portfolio, time horizon, and probability p, the p VaR can be defined informally as the maximum possible loss during the time if we exclude worse outcomes whose probability is less than p. This assumes mark-to-market pricing, and no trading in the portfolio.
Bloomberg recently reported that the combined VaR of the six largest US banks has decreased from $1 billion in 2009 to $279 million. Does this mean that we have much less risk now than before? Not so if we adjust for the decreasing trend in volatility What if we strip it out to get a sense of whether risk-taking has really declined, independent of the broader market? The result won’t be perfect, 3 but it should give us a rough idea. It indicates that, relative to the broader market, the banks’ trading operations are only about 25 percent less risky than they were in 2009 -- and have actually become a bit riskier over the past year. Read more In a similar context, Peter Guy pointed out that, generally speaking, risk models are vulnerable because they were developed and tested in a market environment that can change in the future ... risk models are vulnerable because a decade of zero interest rates have never occurred before in financial and economic history. No one possesses accurate historical data to predict the future. And quantitative models and algorithms heavily depend on historical data for forecasting risk. “There are no models that are able to accurately capture the effect of rising interest rates. You need to reach back to the period before quantitative easing began,” Read more So what are the solutions? One solution is to develop stress scenarios, then use them to calculate probability-weighted, forward-looking risk measures. Additionally, we can implement other VaR variants that better account for the tail risks. Article Source Here: Is Value at Risk a Good Risk Measure?
0 Comments
This post is the continuation of the previous one on the riskiness of OTM vs. ATM short put options and the effect of leverage on the risk measures. In this installment we’re going to perform similar studies with the only exception that from inception until maturity the short options are dynamically hedged. The simulation methodology and parameters are the same as in the previous study. As a reference, results for the static case are replicated here:
Table below summarizes the results for the dynamically hedged case
From the Table above, we observe that:
It is important to note that given the same notional amount, a delta-hedged position is less risky than a static position. For example, the VaR of a static, cash-secured (m=100%) short put position is 0.194, while the VaR of the corresponding dynamically-hedged position is only 0.0073. This explains why proprietary trading firms and hedge funds often engage in the practice of dynamic hedging. Finally, we note that while Value at Risk takes into account the tail risks to some degree, it’s probably not the best measure of tail risks. Using other risk measures that better incorporate the tail risks can alter the results and lead to different conclusions.
Originally Published Here: Are Short Out-of-the-Money Put Options Risky? Part 2: Dynamic Case
Victor Niederhoffer is a famous option seller. According to Wikipedia:
Niederhoffer studied statistics and economics at Harvard University (B.A. 1964) and the University of Chicago (Ph.D. 1969). He was a finance professor at the University of California, Berkeley (1967–1972). In 1965, while still at college, he co-founded with Frank Cross a company called Niederhoffer, Cross and Zeckhauser, Inc., an investment bank which sold privately held firms to public companies. This firm is now called Niederhoffer Henkel, and was run by Lee Henkel (who died May 30, 2008), the former general counsel to the IRS. Niederhoffer pioneered a mass marketing approach in investment banking and did a large volume of small deals at this firm. He also bought many privately held firms with Dan Grossman, his partner during this period. As a college professor in the 1960s and 1970s, Niederhoffer wrote academic articles about market inefficiencies, which led to the founding in 1980 of a trading firm, NCZ Commodities, Inc. (aka Niederhoffer Investments, Inc.). The success of this firm attracted the attention of George Soros. Niederhoffer became a partner of Soros and managed all of the fixed income and foreign exchange from 1982 to 1990.[15] Soros said in The Alchemy of Finance that Niederhoffer was the only one of his managers who retired voluntarily from trading for him while still ahead. Soros held Niederhoffer in such high esteem that he sent his son to work for him to learn how to trade. Read more His trading strategy provided high returns for more than 20 years. However, he suffered a huge loss in 1997. …reward comes with risk, and Niederhoffer embraced risk in ways that would eventually become costly. He got caught leaning the wrong way when the Asian financial crisis hit in 1997, all but completely wiping his fund out. But he slowly rebuilt, and once again amassed another fortune, only to see this capital pool destroyed by the financial crisis of 2007-09. Bloomberg recently interviewed Niederhoffer. Niederhoffer is a brilliant and fascinating character, a study of rich contrasts. He is a nationally ranked squash champion, and former Berkeley professor of finance and statistics. He is an undeniably talented trader, except for that small issue of occasionally blowing up and getting wiped out. I am not sure that he fully accepts responsibility for his various disasters. His trading record is akin to setting the track record on the straightaways, only to crash into the wall on the curves. Still, he teaches an important lesson for any trader. As revealed in his first book, “The Education of a Speculator,” the risk-embracing style that created his first fortune comes with some caveats. Read more Click here to listen to the interview. Is shorting volatility a dangerous game? ByMarketNews Published via http://harbourfronttechnologies.blogspot.com/ The volatility index was created more than 30 years ago. Since then it has become a favorite tool for both speculation and risk management. There is now strong evidence that VIX futures and related exchange-traded products are changing the market dynamics. Specifically, in the early days of the VIX, the cash market led the futures. But since 2012, VIX futures leads cash 75% of the time. [caption id="attachment_413" align="aligncenter" width="794"] Business Insider recently interviewed two of the creators of the volatility index, Robert Whaley and Dan Galai. Here are the key takeaways from R. Whaley interview,
Regarding bullet point #1, we have repeatedly said that VIX futures are (risk-neutral) expectation values of forward volatilities, and not spot VIX. Furthermore, since they are expection values in the risk-neutral world, they do not represent the future expected value of the spot VIX in the physical measure. Here are the key takeaways from Dan Galai interview
Originally Published Here: What Do Creators of the VIX Think of Volatility?
Dan Galai was a co-creator (along with M. Brenner and R. Whaley) of VIX, the volatility index. According to Wikipedia:
The formulation of a volatility index, and financial instruments based on such an index, were developed by Menachem Brenner and Dan Galai in 1986 and described in academic papers.The authors stated the “volatility index, to be named Sigma Index, would be updated frequently and used as the underlying asset for futures and options. … A volatility index would play the same role as the market index play for options and futures on the index.” In 1986, Brenner and Galai proposed to the American Stock Exchange the creation of a series of volatility indices, beginning with an index on stock market volatility, and moving to interest rate and foreign exchange rate volatility. In 1987, Brenner and Galai met with Joseph Levine and Deborah Clayworth at the Chicago Board of Options Exchange to propose various structures for a tradeable index on volatility; those discussions continued until 1991. The current VIX concept formulates a theoretical expectation of stock market volatility in the near future. The current VIX index value quotes the expected annualized change in the S&P 500 index over the next 30 days, as computed from the options-based theory and current options-market data. The CBOE retained consultant Robert Whaley in 1992 to develop a tradable volatility instrument based on index option prices. Since 1993, CBOE has published VIX real-time data. Based on historical index option prices, Whaley has computed a data series of retrospective daily VIX levels from January 1986 onward. Read more 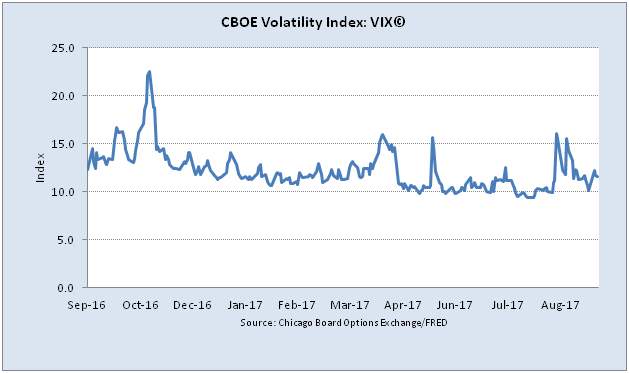 He recently gave an interview to Business Insider. Here are the key takeaways
ByMarketNews Published via http://harbourfronttechnologies.blogspot.com/ |
Archives
April 2023
|
||||||||||||||||||||||||||||||||||||||||||||||||||||||||||||||||||||||
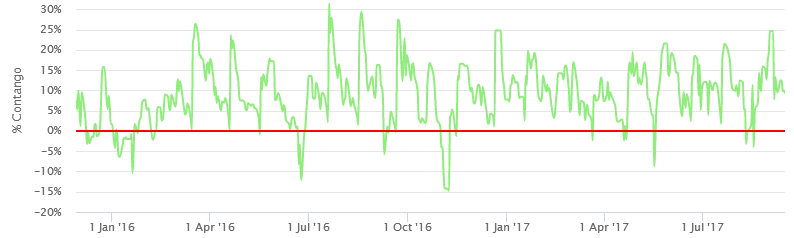 VIX Contango as at Sep 15, 2017. Source: vixcentral.com[/caption]
 RSS Feed
