|
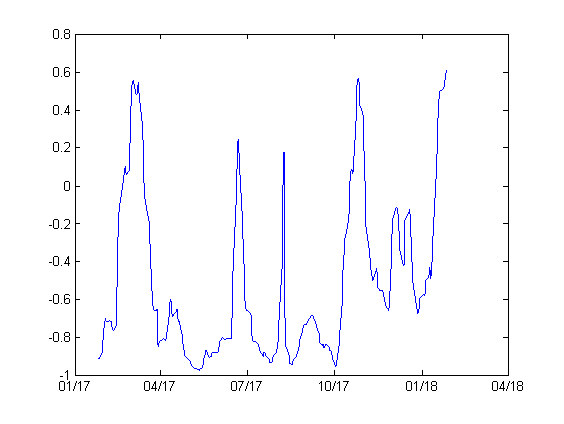
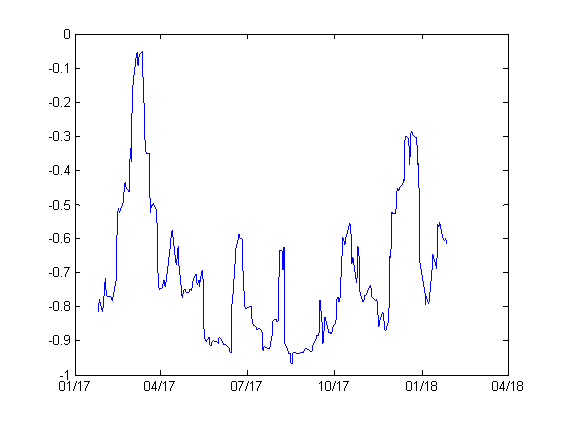
Last week, many traders noticed that there was a divergence between SPX and VIX. It’s true if we look at the price series. Graph below shows the 20-day rolling correlation between SPX and VIX prices for the last year. We can see that the correlation has been positive lately. [caption id="attachment_327" align="aligncenter" width="564"] However, if we look at the correlation between SPX daily returns and VIX changes, it’s more or less in line with the long term average of -0.79. So the divergence was not significant. [caption id="attachment_328" align="aligncenter" width="564"] The implied volatility (VIX) actually tracked the realized volatility (not shown) quite well. The latter happened to increase when the market has moved to the upside since the beginning of the year. Originally Published Here: Correlation Between SPX and VIX
0 Comments
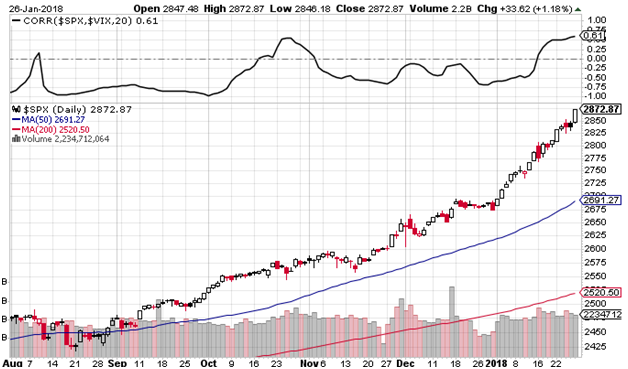
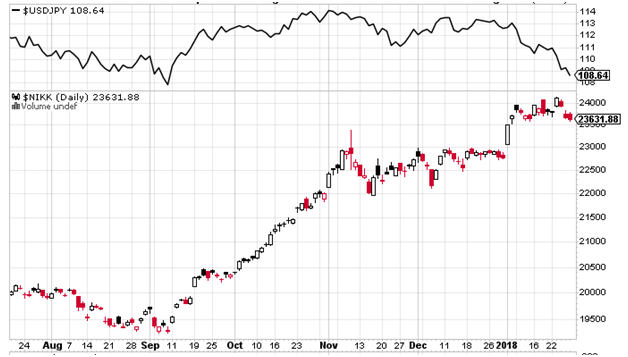
The US equity market just reached new highs, and it broke many records. For example, Bloomberg reported that the US market had not been overbought like this in 21 years. The S&P 500 Index’s superlative start to 2018 is making a contrarian technical indicator look silly. The benchmark gauge is poised to end trading Thursday with a 16th straight day in overbought territory, as judged by the Relative Strength Index. That would be the longest such run in more than two decades. A close above 70 on Thursday passes the 15-session string seen in October. From Nov. 6 through Dec. 2, 1996, the gauge’s overbought streak reached 18 sessions. Read more The rare behavior of the equity index not only manifested itself in the overbought level, but also in the breakdown of correlation. The chart below shows the 20-day rolling correlation (upper panel) between the SPX and the volatility index, VIX. Usually, the correlation is negative, in the order of -0.79. However, it has been in the positive territory for more than a week now. [caption id="attachment_449" align="aligncenter" width="628"] We notice that there has been a breakdown in the Nikkei stock market and USDJPY correlation as well. The chart below shows the USDJPY (upper panel) and the Nikkei 225 equity index (lower panel). The relationship was usually positive. But since November of last year, it broke down: a stronger Japanese Yen did not lead to a weaker equity market and vice versa.
[caption id="attachment_450" align="aligncenter" width="628"] For the moment, we are not going to delve deeper into the reasons behind these correlation breakdowns. We note, however, that if correlations don’t revert back to normal within a reasonable time frame, then there might be a shift in the market fundamentals. Post Source Here: Correlation Breakdown
We have written about how the increase in popularity of VIX-related Exchange Traded Products could impact the financial market:
Is Volatility of Volatility Increasing? What Caused the Increase in Volatility of Volatility? Recently, Goldman Sachs derivatives analyst Rocky Fishman expressed concerns regarding the impact of VIX ETPs positions on the markets. Fishman wrote to clients early Thursday morning that he has no concerns about the net number of shorts but is concerned about the impact a sudden rise in the VIX futures would have on derivative products. He notes that over the past few weeks net positioning in VIX ETPs has gone short for only the second time in their eight year history. The analyst believes “the potential for short and levered ETPs to start buying VIX futures quickly on a sudden vol spike has grown” which in turn makes short-date VIX-based hedges timely. Therefore, his biggest concern is a one-day, end-of-day vol spike should the SPX selloff near the end of the trading day which would push issuers to replace positions quickly to avoid being exposed to unhedged overnight risk or excessive tracking error. Fishman also notes that Asset Managers and Institutions appear most at risk as they have recently started reporting short VIX futures positions. Perhaps we should just hope that there won’t be a negative market headline in the final minutes of any trading day anytime soon but should any of our readers wish to know the derivatives analyst would prepare for something jarring in the short term, Fishman suggests that client buy February 18-strike VIX call versus selling April 18-strike VIX calls with an intention to close the trade before the February 14 expiry. Read more At the same time, Bloomberg also reported that the 50-cent VIX player started buying short-dated options This entailed buying back 262,500 January VIX puts with a strike price of 12, selling 262,500 15 calls, and buying back 525,000 25 calls in order to close out the existing position. Then, the new position was established by selling 262,500 12 February puts, buying 262,500 15 calls, and selling 525,000 25 calls. While the ‘Elephant’ originally traded three-month options, rolling after two months, they appear to have switched to a one-month cycle More generally, the ‘Elephant’ trades reflect a trend towards low premium outlay hedges with minimal convexity,” the strategist concludes. “Clients we talk to have been more interested in VIX call flies or S&P put flies that carry well and have a fairly low initial cost, but may not mark up as much as an outright option in a risk-off scenario. Read more You can invest in volatility ETPs, but be prudent and hedge the risks accordingly. ByMarketNews Published via http://harbourfronttechnologies.blogspot.com/ |
Archives
April 2023
|

 20-day rolling correlation SPX-VIX prices, ending Jan 26 2018[/caption]
 20-day rolling correlation SPX return -VIX changes ending Jan 26 2018[/caption]
 SPX and VIX correlation as at Jan 26 2018. Source: Stockcharts.com[/caption]
 Nikkei 225 and USDJPY as at Jan 26 2018. Source: Stockcharts.com[/caption]
 RSS Feed
