Derivative Valuation, Risk Management, Volatility Trading

|
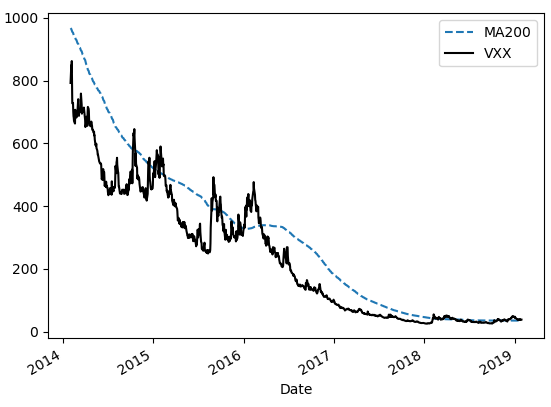
In the previous post, we presented a system for trading VXX, a volatility Exchange Traded Note. The trading system was built based on simple moving averages. In this post, we are going to examine the time series properties of VXX in more details. The figure below shows the VXX and its 200-day moving average for the last 5 years. From the Figure, it’s evident that the time series has a strong downward drift. The cause of this downward drift has been discussed to a great extent in the investment community. It will not be a subject of this post.
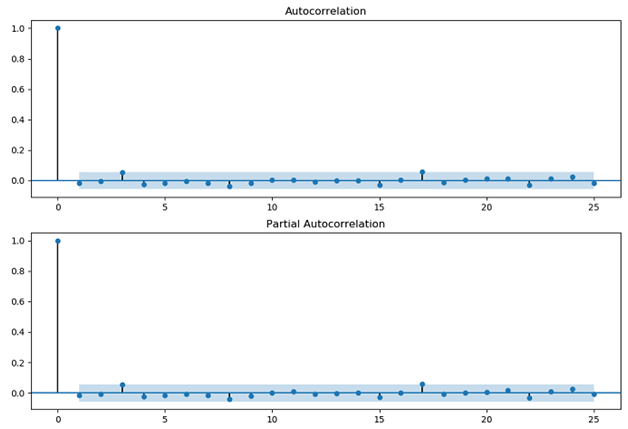
Next, we calculate the daily returns of VXX and perform the Augmented Dickey-Fuller test to check the stationarity of the return series. According to Wikipedia, ..An augmented Dickey-Fuller test (ADF) tests the null hypothesis that a unit root is present in a time series sample. The alternative hypothesis is different depending on which version of the test is used, but is usually stationarity or trend-stationarity. It is an augmented version of the Dickey-Fuller test for a larger and more complicated set of time series models. The augmented Dickey-Fuller (ADF) statistic, used in the test, is a negative number. The more negative it is, the stronger the rejection of the hypothesis that there is a unit root at some level of confidence. Read more We utilize Python to run ADF test on the return series. The test statistic is -19.5 and the p-value is zero. Therefore the return series is stationary. We then proceed to examine the autocorrelation functions of VXX returns. Autocorrelation, also known as serial correlation, is the correlation of a signal with a delayed copy of itself as a function of delay. Informally, it is the similarity between observations as a function of the time lag between them. The analysis of autocorrelation is a mathematical tool for finding repeating patterns... Read more The plot below shows the autocorrelation (ACF) and partial autocorrelation (PACF) functions of VXX returns.
It’s interesting to note that VXX returns are positively auto-correlated at 3-day lag. It’s well-known that the stock indices are mean reverting in the short term. Here we observe the opposite, i.e. a trending property. Click on the link below to download the Python program and data file. Post Source Here: Stationarity and Autocorrelation Functions of VXX-Time Series Analysis in Python
0 Comments
Time series analysis is an important subject in finance. In this post, we are going to apply a time series technique to a financial time series and develop an investment strategy. Specifically, we are going to use moving averages to trade volatility Exchange Traded Notes (ETN). Moving averages are used on financial time series data to smooth out short-term noises and identify longer-term trends. We apply them to VXX, a volatility ETN. Note that VXX
The trading rules are as follows [1], If 10-day Moving Average (MA10) < 30-day Moving Average (MA30) Sell Short If 10-day Moving Average (MA10) >= 30-day Moving Average (MA30) Cover Short The system is implemented in Python. Graph below shows the MAs and VXX for the last 2 years. [caption id="attachment_654" align="aligncenter" width="540"] The position size is $10000; leverage is not utilized, and profit is not compounded. Graph below shows the equity curve for the trading strategy from January 2009 to January 2019. [caption id="attachment_655" align="aligncenter" width="564"] Click on the link below to download the Python program and data file.
References [1] L. Connors, Buy the Fear, Sell the Greed: 7 Behavioral Quant Strategies for Traders, TradingMarkets Publishing, 2018
Post Source Here: A Volatility Trading System-Time Series Analysis in Python |
Archives
April 2023
|
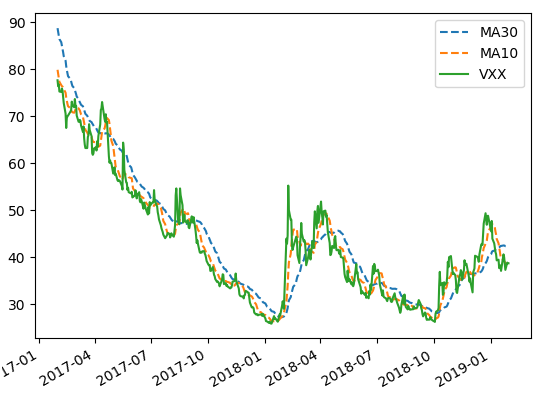 VXX and Moving Averages[/caption]
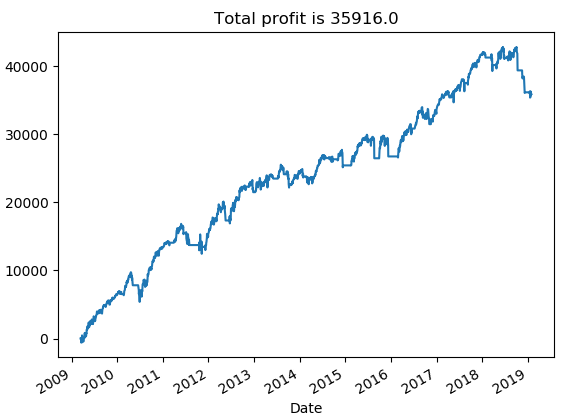 Equity curve for VXX trading system[/caption]
 RSS Feed
