Derivative Valuation, Risk Management, Volatility Trading

|
Time series analysis is an important subject in finance. In this post, we are going to apply a time series technique to a financial time series and develop an investment strategy. Specifically, we are going to use moving averages to trade volatility Exchange Traded Notes (ETN). Moving averages are used on financial time series data to smooth out short-term noises and identify longer-term trends. We apply them to VXX, a volatility ETN. Note that VXX
The trading rules are as follows [1], If 10-day Moving Average (MA10) < 30-day Moving Average (MA30) Sell Short If 10-day Moving Average (MA10) >= 30-day Moving Average (MA30) Cover Short The system is implemented in Python. Graph below shows the MAs and VXX for the last 2 years. [caption id="attachment_654" align="aligncenter" width="540"] The position size is $10000; leverage is not utilized, and profit is not compounded. Graph below shows the equity curve for the trading strategy from January 2009 to January 2019. [caption id="attachment_655" align="aligncenter" width="564"] Click on the link below to download the Python program and data file.
References [1] L. Connors, Buy the Fear, Sell the Greed: 7 Behavioral Quant Strategies for Traders, TradingMarkets Publishing, 2018
Post Source Here: A Volatility Trading System-Time Series Analysis in Python
0 Comments
Leave a Reply. |
Archives
April 2023
|
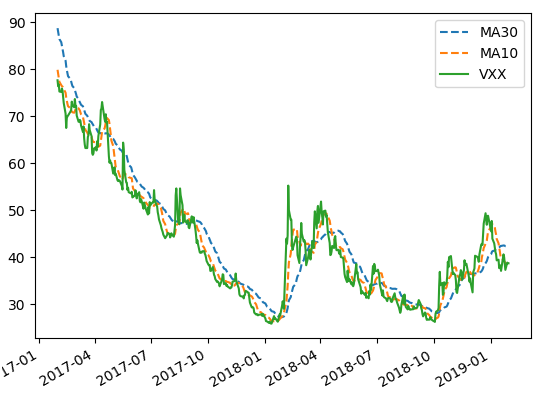 VXX and Moving Averages[/caption]
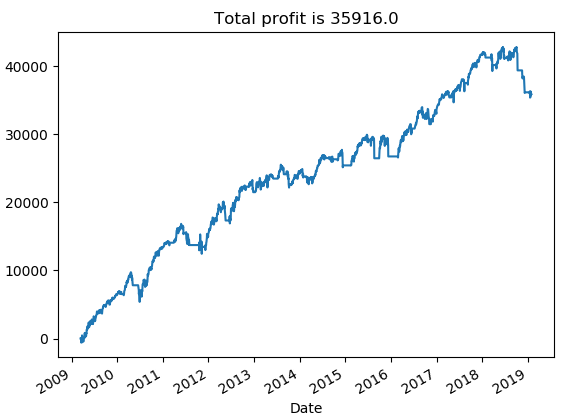 Equity curve for VXX trading system[/caption]
 RSS Feed
