Derivative Valuation, Risk Management, Volatility Trading

|
Credit risk refers to the uncertainty associated with repayments from borrowers. When a lender provides a loan to a borrower, they expect future interest and principal repayments. However, borrowers may not fulfill their end of the bargain. For every debt transaction, credit risk will exist. Therefore, lenders always have to make provisions in case the risk realizes. Sometimes, however, credit risks may be inevitable. Lenders will always suffer from a borrower's inability to repay the loan. Sometimes, they may lose the full amount of the loan. In other cases, they may be able to recover a portion of the debt. For that, they can calculate the recovery rate of the debt obligation. What is the Recovery Rate?Recovery rate refers to the amount that lenders recover when a borrower defaults on loan repayments. Lenders can calculate the recovery rate of a bond or loan as a percentage of the total amount. For securities, the recovery rate may represent the value when the securities emerge from default or bankruptcy. There are several factors that may play a role in the recovery rate. For bonds, the recovery rate shows the extent to which lenders can recover the principal and accrued interest on a defaulted bond. The recovery rate comes in the form of a percentage of the bond's face value. Using the recovery rate, lenders can estimate the loss that they would make if the bond defaults. The higher a bond's recovery rate is, the lower the loss will be for the lender. How does Recovery Rate work?As mentioned, various factors may affect a debt's recovery rate. The credit rating of the borrower and the type of instrument play a significant role in it. Similarly, the instrument's seniority within the issuer's capital structure also plays a role in it. The relationship between recovery rate and instrument seniority is direct. As mentioned, the concept of recovery rate is close to that of credit risk. The concept of recovery rate also applies to cash loans or credits that lenders recover through bankruptcy or foreclosure. Calculating the recovery rate accurately can be helpful for lenders in deciding the terms for their credit transactions. This concept applies to all loans. For example, the lower the borrower's credit rating is, the higher the interest rate on the debt will be. How bond Recovery Rate is calculated?The formula to calculate the recovery rate of a loan is as below. Recovery Rate = Amount Recovered / Loan Value The amount recovered signifies the total repayment that the lender receives over the loan's lifecycle. On the other hand, the loan value shows the total amount that the lender provided to the borrower. For bond recovery rate calculation, the formula will become as follows. Recovery Rate = Amount Recovered / Face Value of the Bond Therefore, if a bond issuer recovers $80 on a bond with a face value of $100, the recovery rate will be 80%. Lenders can also use the above formula for a specific time period or type of bond to get more specific results. ConclusionRecovery rate is a term often associated with credit risk. The recovery rate shows the amount that lenders can recover from borrowers in case of a default. The calculation for the recovery rate is straightforward. Lenders need to calculate the amount they have recovered from debt and divide it by its total value. The higher the recovery rate is, the better it is for the lender. Article Source Here: How Bond Recovery Rate Is Calculated
0 Comments
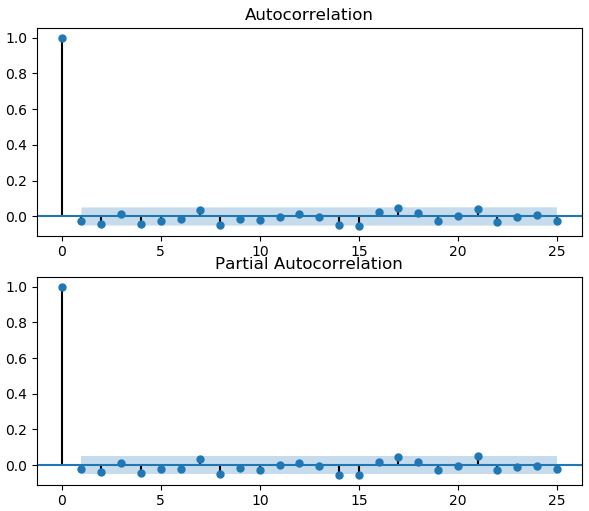
A technical or quantitative trading system on a linear (i.e. delta 1) instrument is basically a bet on the autocorrelation of the underlying. The autocorrelation properties of the underlying can be examined directly through autocorrelation functions or indirectly through the Hurst exponent. In this post, we are going to examine the mean-reverting and trending properties of SP500 directly using the autocorrelation functions. We do so with the goal of designing quantitative trading systems on stock indices. Recall that, Autocorrelation, also known as serial correlation, is the correlation of a signal with a delayed copy of itself as a function of delay. Informally, it is the similarity between observations as a function of the time lag between them. The analysis of autocorrelation is a mathematical tool for finding repeating patterns, such as the presence of a periodic signal obscured by noise, or identifying the missing fundamental frequency in a signal implied by its harmonic frequencies. It is often used in signal processing for analyzing functions or series of values, such as time domain signals. Read more We implemented the autocorrelation functions in Python. We downloaded SPY data from 2009 to the present from Yahoo Finance. We then applied the Python program to the daily and monthly returns of SPY. The graph below shows the autocorrelation (ACF) and partial autocorrelation (PACF) functions of daily SPY returns. We note that SPY returns are negatively correlated at lags 2-4, i.e. SPY is mean-reverting in the short term. This is consistent with the findings in the previous study performed using the Hurst exponent.
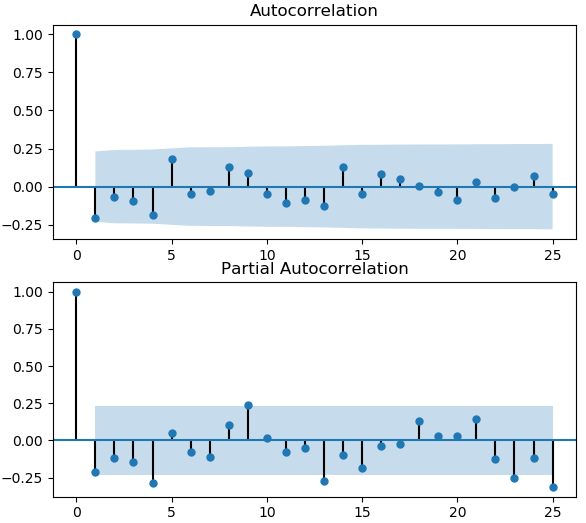
The graph below shows the autocorrelation and partial autocorrelation functions of monthly SPY returns. We observe that the monthly returns are positively correlated around lag 9. This means that in a long term, SPY is trending.
In summary, using the autocorrelation functions, we demonstrated that the SP500 is mean-reverting in the short term and trending in the long term. In the next installment, we will design a trading system based on the mean-reverting and trending properties of SPY. Click on the link below to download the Python program and data files. Article Source Here: Autocorrelation Properties of SP500-Quantitative Trading in Python What is the Law of One Price?The Law of One Price (LOOP) is an economic theory that suggests that after accounting for the difference in currency exchange rates, the prices of identical goods in various markets will be the same. This law applies to financial markets and the securities traded on them. However, it makes some assumptions, which must be true for it to work. The law of one price depends on various principles. These include free-market competition, price stability, and lack of trade restrictions. In an efficient market, the law of one price will always apply. It also provides the basis for the purchasing power parity principle in economics. How does the Law of One Price work?The law of one price works in an efficient market, where no legal restrictions, transactions costs, or transportation costs exist. Similarly, it assumes that the currency exchange rates are the same. Lastly, it works on the basis that buyers or sellers cannot manipulate prices in various markets. This law applies to a wide range of securities. The law of one price exists due to arbitrage opportunities. When security prices differ across various markets, investors can profit from buying in the market with lower rates and selling in higher rate markets. For those securities, an arbitrage opportunity exists. However, due to the exploitation of these opportunities, the securities' prices would reach an equilibrium. Without the law of one price, the concept of purchasing power parity is not achievable. The law of one price states that the price of securities would remain the same in different markets. It is one of the crucial assumptions made for the purchasing power parity. However, because security prices may differ in various markets or due to investors' inability to access markets, it may not apply. The law of one price is prevalent in financial markets. Due to the lower trade barriers and the high regulations that apply in these markets, this law is more applicable. The law of one price also works best with commodities. These prices remain similar throughout various markets. Therefore, commodities conserve the law of one price. What are the limitations of the Law of One Price?The primary limitations of the law of one price come from its assumptions. As mentioned, the law of one price makes several assumptions, which may not always apply. Firstly, it assumes that there are no transportation costs. If the difference between commodity prices does not come due to transportation costs, it may signify a shortage or excess within a region. Similarly, the law assumes that there are no transaction costs. In the real world, however, transaction costs exist for all assets and securities. Likewise, the law of one price does not consider the legal restrictions between various countries or markets. However, these can have a similar impact on prices as transaction and transportation costs. ConclusionThe law of one price is a theory in economics. It suggests that the prices of identical goods across various markets will remain the same after considering the difference in forex exchange rates. This law is more prevalent in the financial markets than for other goods or services. The law of one price makes several assumptions, which can result in some limitations. Originally Published Here: What Is The Law Of One Price? What is a Swap Rate?A swap rate is a fixed rate that comes with swaps. The rate differs based on the parties involved in the contract and the market in which they transact. There are various types of swap rates, such as the interest rate swap or currency swap. With swap rates, there are usually two parties, the payer and the receiver. The receiver is the party that receives or demands the fixed rate. The payer, on the other hand, is the party that pays or offers the fixed rate. With swap rates, receivers get compensated for any uncertainty revolving around floating interest rates. This way, they can mitigate the risks that come with fluctuations in floating-rate instruments. For interest-rate swaps, the payer exchanges a fixed interest rate for a benchmark rate. There are various types of currency swaps. These may include exchanging the fixed rate of one currency for the floating rate of another. How does a Swap Rate work?Swap rates may come with different instruments or swaps. As mentioned, there are two types of swap rates. With interest swap rates, two parties exchange floating and fixed interest rates. Usually, they do so to avoid the uncertainty associated with floating interest rates that come with instruments. After a period, one party compensates the other for the differences in the interest payments. On the other hand, a currency swap may come in different forms. It may include the exchange of a fixed rate in one currency for the fixed rate in another. It may also consist of exchanging a fixed rate to floating rate and floating rate to floating rate between two currencies. The purpose of currency swaps is to avoid the risk associated with forex exchange rates. What is an Interest Rate Swap?An interest rate swap involves a contract between two parties to exchange their future interest payments on a loan or bond. It may exist between individuals, companies, or financial institutions. Swaps are derivative contracts. Therefore, interest rate swaps get their value from the underlying value of the interest payment streams. With interest rate swaps, both parties can exchange their interest payments from their respective loan or bond. However, the underlying debt instruments remain with the original borrower. Since interest rate swaps involve the exchange of floating and fixed interest rates, the interest payment on them may differ. At the end of each period, one of the involved parties pays or receives the excess interest payments. What is a Currency Swap?While interest rate swaps focus on mitigating the uncertainty that comes with interest rates, currency swaps involve currency exchange rates. The parties involved in currency swaps don't net off the difference in interest payments. Instead, they calculate and pay the difference in the currencies involved. Both parties will also fix the date or time for payments throughout the contract's lifecycle. Most investors use it to hedge long-term investments. Some parties may also use it to change the interest rate exposure of the parties involved. Some parties may also use it to get more favourable loan rates at a foreign location than they can get in their country of origin. ConclusionSwap rates involved the exchange of interest payments at a fixed rate. There are two types of interest rate swaps prevalent in the market, including interest rate swaps and currency swaps. The focus of interest rate swaps is to mitigate the risks involved in interest payments. For currency swaps, the focus may be currency exchange rate variations. Originally Published Here: What Is A Swap Rate? Forward rate and spot rate are two terms used to describe different aspects of interest rates. These are common in various markets. However, they have different meanings according to the market where they are prevalent. These are most common in bond markets but may also apply to other contracts or instruments. The differences between forward and spot rates are as below. What is Forward Rate?The forward rate represents the expected values of future financial transactions that investors can expect to occur in the future. Therefore, forward rates apply to all financial transactions with a value or maturity in the future. Investors can use the spot rate to calculate an instrument or option's forward rate. In some markets, the forward rate may also refer to the predetermined or fixed rate for financial obligations. A forward interest rate shows the coupon rate on a bond or interest rate on a loan that will commence sometime in the future. Therefore, the forward interest rate represents the rate that will apply to a transaction in the future. Forward rates are crucial in bond markets. When investors buy a bond in the market, they consider its forward and spot rate. The price of a bond or instrument depends on its future returns. When buying a bond nearing its maturity, the bond's forward rate will be higher than its interest rate. The difference between spot and forward rate may be significant. Investors can use various models or approaches towards calculating the forward rate. What is Spot Rate?The spot interest rate represents the price of a financial instrument on a spot date. The spot date refers to the day when investors pay funds for the transfer of the financial instrument. It may be on the same day as participants complete the transaction. Usually, however, it is two days after the trade. Usually, the spot rate represents the current market rate of security for immediate settlement. A contract or instrument’s spot rate may vary over time and based on the market. However, the prices stay similar across various markets. This way, there is no room for arbitrage exploitation due to price disparities. The spot rate also plays a significant role in the calculation of the forward rate. Based on the spot rate, investors can estimate the fluctuations in future commodity prices. Investors use a spot rate when looking to make immediate purchases or sales. However, they use the forward rate to develop expectations for future prices. Investors can use it as an economic indicator of how they expect the future to perform. However, spot rates do not indicate market expectations or future prices. What are the differences between Forward and Spot Rate?As mentioned, the meaning of forward and spot rates may differ across various markets. With bonds, the forward rate represents the effective yield on a bond or US Treasury bills. In contrast, the spot rate refers to the price of a financial contract on the spot date. As mentioned, the spot date may be on the same day as the transaction, but it normally occurs within two days after a trade. ConclusionThere are two terms commonly associated with bonds. These include spot and forward interest rates. The meaning for these may differ based on the market they are used. However, forward rates usually indicate the effective yield on a bond. The spot rate, in contrast, shows the expected price of a bond on the spot date, which is usually two days after the trade. Originally Published Here: Forward Rate vs Spot Rate Determining the value of a public company is relatively straightforward. That is primarily due to the vast amount of publicly available information. Some analysts may provide these valuations for free to the general public. However, the same does not apply to private companies. Determining the value of a private company is a complicated process. What is a Private Company?A private company is a company that has limited or closed ownership. The shares of these companies are not available in the stock market. However, that does not mean that others cannot buy the company’s shares. Private company stockholders may trade their shares to other existing or new stockholders. However, attracting new stockholders is not as straightforward. With public companies, the value of shares is available through the stock market. However, new investors may be reluctant to invest in private companies. Usually, private company shares are less liquid compared to public-listed companies. It introduces many challenges for private companies when it comes to obtaining finance. How to value a Private Company?The information that investors use to value a public company may not be available for private companies. Therefore, the traditional methods of company valuation are not applicable to private companies. Hence, investors will have to use other methods for valuing private companies. There are various approaches to do so, two of which are as below. Comparable Company Analysis or Market ApproachWith the market approach, investors can use a comparable company analysis (CCA) to value a private company. With this approach, investors identify public companies in the same industry as the company under consideration. Usually, the closer in growth, size, and age the public-listed companies are to the private company, the better it is. With the market approach, investors can determine a close estimate of the private company's value. Once investors calculate the price and cash flow metrics for the comparable companies, they can use it to calculate the subject company's estimates. They can also calculate the EBITDA multiple for the subject company and use it to calculate its enterprise value. Investors may also use comparative information from recent IPOs of other companies of similar size for this calculation. However, there are various problems with using comparable company analysis to do so. The primary issue with this approach is the research that investors must perform. Finding companies of similar size may not be possible. Present Value ApproachThe present value method is similar to public companies. Investors can estimate a private company's value based on the present value of its forecasted cash flows. However, this approach also requires investors to make estimations about a company's future cash flows. Once they obtain the relevant information, they must calculate the discount rate to determine the present value of cash flows. The primary source of calculating a private company’s value under this approach is using its revenues. After an investor establishes a revenue growth rate, they can make forecasts about its future performances. Using this information, they can calculate a company's free cash flows, which they can then use with Discounted Cash Flow (DCF) method. Investors need to perform various estimations based on which they can calculate the private company’s value. These estimations can significantly alter a company’s value. Therefore, it is crucial for investors to perform accurate calculations and forecasts. ConclusionDue to the lack of information available for private companies, investors may find it difficult to determine their value. Private companies represent a closed ownership structure for which investors can't find shares in the public market. However, investors can still use several approaches to calculate their value, including the market and present value approaches. Article Source Here: How Do You Value a Private Company What are Generally Accepted Accounting Principles?Generally Accepted Accounting Principles (GAAP) represent a set of accounting standards, rules, and principles issued by the Financial Accounting Standard Board (FASB). GAAP is one of the two prevalent accounting standards used throughout the world, the other being IFRS. While IFRS has a worldwide application, GAAP is mostly applicable in the US. GAAP dictates how companies and other organizations prepare their financial statements. It provides rules for each aspect of accounting treatments, allowing a uniform accounting process throughout the US. For publicly-listed companies, using GAAP is mandatory. For other companies or organizations, however, it is not compulsory. Through GAAP, companies can provide stakeholders with comparable and standardized financial reports. GAAP aims to make the financial reporting process of various companies more consistent and clearer. However, this only applies to financial reports within the US. For financial statements prepared using other standards, comparability with GAAP may not be straightforward. Who is responsible for regulating Generally Accepted Accounting Principles?As mentioned, the Financial Accounting Standards Board (FASB) regulates Generally Accepted Accounting Principles. Formed in 1973 as a successor to the Accounting Principles Board, the FASAB establishes and interprets GAAP standards in the US. The FASB handles GAAP standards for companies, government organizations, and nonprofits. The Financial Accounting Standards Board works under various organizations. These include the Financial Accounting Foundation, the Financial Accounting Standards Advisory Council, the Governmental Accounting Standards Board, and the Governmental Accounting Standards Advisory Council. These organizations aim to improve financial accounting and reporting standards. Ultimately, the purpose is to provide useful information to investors and other users of the financial statements. What are the 10 Principles of Generally Accepted Accounting Principles?There are ten principles that define the mission of GAAP standards. These are as below. 1. Principle of RegularityThis principle states that the accountant has complied with the GAAP rules and regulations. 2. Principle of ConsistencyThis principle ensures that accountants use GAAP standards throughout the reporting process. GAAP is not a set of selective standards. Similarly, accountants must fully disclose and explain the reasons behind any changed or updated standards. 3. Principle of SincerityThis principle states that accountants must provide an accurate and impartial presentation of a company's financial situation. 4. Principle of Permanence of MethodsThis principle states that accountants should use consistent procedures in their financial reporting. 5. Principle of Non-CompensationThis principle states that accountants must report all aspects of a company’s performance, whether positive or negative. They should not compensate debts with assets. 6. Principle of PrudenceThis principle states that accountants should report factual financial data and not that based on speculation. 7. Principle of ContinuityThis principle states that when reporting, accountants should assume the business will continue to operate in the future. 8. Principle of PeriodicityThis principle states that accountants should report financial information in the relevant accounting period to which it relates. 9. Principle of MaterialityThis principle states that accountants must fully disclose all financial data and accounting information in financial reports. 10. Principle of Utmost Good FaithThis principle states that all parties should remain honest in their transactions. ConclusionGenerally Accepted Accounting Principles are a set of rules and standards for financial reporting. These are prevalent in the US and mandatory for public companies to use. GAAP comes from the Financial Accounting Standards Board. GAAP consists of 10 principles, which define how accountants and companies must report their financial information. Originally Published Here: Generally Accepted Accounting Principles What is an Interest Rate Swap?An interest rate swap is a type of financial derivatives that allows participants to exchange their interest payments. With interest rate swaps, two parties can enter a forward contract to pay off each other's interest payments. Usually, both parties agree on the terms of the agreement. These terms also specify the principal amount for the swap. Interest rate swaps usually involve exchanging fixed-rate debt instruments with floating-rate ones. The reason why participants do so is to mitigate or reduce their exposure to interest rate fluctuations. Since the rate on both payments differs, each party will be liable to pay a different amount. However, both parties agree to net off the payments and only pay for the residual amount. Therefore, one party will always benefit while the other will make a loss. Sometimes, however, participants may also exchange floating interest rate instruments with other floating-rate debts. Participants may do so to avoid the risks involved with a specific type of debt. This type of interest rate swap is known as a basis swap. How do Interest Rate Swaps work?Interest rate swaps include two parties. As mentioned, one party usually receives fixed rate interest payments while the other gets floating-rate interest. Both parties mutually agree to the exchange and specify the conditions for the agreement. The reason why they may do so differs according to each party's requirements. Usually, however, it includes mitigating risks associated with a specific type of interest payments. However, it does not imply that one party will be loss-making. The party receiving fixed-rate payments gets the advantage of paying fixed interests. If the market interest rates increase, the receiver of the fixed-rate payments will be at an advantage. However, the other party also benefits if the interest rates go down. In that case, they will have to pay lower interests than they would if they paid fixed rates. Interest rate swaps only include the exchange of interest payments. The underlying debt instruments stay with the original receiver. The contract only specifies that each party will pay the difference in loan payments according to the agreement’s specifications. Therefore, they do not have to make full payments. Instead, they only compensate the other party for the additional interest payment on their debt instrument. What are the risks associated with Interest Rate Swaps?Interest rate swaps include two types of risks. These include credit risk and interest rate risks. When two parties exchange their interest payments, they face the risk that the opposing party will fail to honour their obligations. Since the contract does not involve exchanging the underlying debt instrument, the original receiver will be liable for the default. Similarly, interest rate swaps come with interest rate risks. The risk that fluctuations in interest rates may cause higher or lower obligations for each party is a part of the contract. While one party can benefit from transferring their interest rate risks, the other party will always be at risk. Apart from these, interest rate swaps may include more other risks, such as market risk or counterparty risk. What are the types of Interest Rate Swaps?Based on the underlying debt instruments involved, there are three prominent types of interest rate swaps. The most common among these is the fixed-to-floating and floating-to-fixed interest rate swaps. Sometimes, however, both parties in a swap agreement may also enter into a float-to-float swap contract. All of these types of interest rate swaps have different characteristics. Fixed-to-FloatingA fixed to floating interest rate allows one party to exchange their fixed-rate debt for a floating rate debt. There are several reasons to do so. While floating rate interest payments come with higher uncertainty, they can also offer more rewards. An entity may enter a fixed-to-floating interest rate swap to get better cash flows or reduce its risks. This type of interest rate swap can be significantly beneficial when market interest rates are decreasing. Floating-to-FixedThe floating-to-fixed interest rate swap agreement allows a party to exchange a floating interest debt for a fixed-rate one. With this agreement, the party can get better security when it comes to interest payments. Fixed interest payments are easier to predict and, therefore, better to manage. By disposing of floating rate interest payments for fixed instruments, the party can reduce their risks. This type of swap is beneficial when market interest rates are growing. Float-to-FloatA float-to-float interest rate swap allows one party to exchange their floating rate debt for another floating rate one. This type of interest rate swap is known as a basis swap. It is not as common as exchanging floating debt for fixed-rate debt. However, it still can be beneficial to get more favourable terms for interest payments. For example, one party may exchange their three-month LIBOR debt instrument for a six-month LIBOR or vice versa. What is an Interest Rate Swap example?Two companies, Red Co. and Blue Co., enter into an interest rate swap agreement. Red Co. holds a fixed-rate instrument that comes with a 5% fixed coupon rate. On the other hand, Blue Co. carries a floating rate debt with a LIBOR rate plus a 1% interest rate. At the time of the swap, the LIBOR rate is 4%. Both debts also have a nominal value of $100,000 with annual interest payments. After the swap agreement, Red Co. has to pay for the floating rate debt while Blue Co. has to handle fixed-rate payments. At the end of the first year, the LIBOR rate decreases to 3.5%. Therefore, Red Co. must make an interest payment of $4,500 ($100,000 x [3.5% + 1%]). On the other hand, Blue Co. must make an interest payment of $5,000 ($100,000 x 5%). Both parties net off their payments, and subsequently, Blue Co. will pay Red Co. the $500 difference. At the end of the next year, the LIBOR rates rise to 4.5%. In this case, Red Co. will be liable to pay $5,500 ($100,000 x [4.5% + 1%]). On the other hand, Blue Co.’s liability will remain fixed at $5,000. During the second year, Red Co. will pay Blue Co. the $500 difference in both payments. How to price an Interest Rate Swap?To value an interest rate swap, fixed and floating legs are priced separately using the discounted cash flow approach. Specifically, The valuation of an interest rate swap proceeds as follows,
This method for valuing an Interest Rate Swap can be implemented in Excel or Python. How to account for Interest Rate Swaps?The accounting for interest rate swaps considers the adjustment amount receive or paid to the other party. As mentioned, both parties in the interest rate swap do not pay each other’s interest payments. They pay or receive the adjusted difference between the interest payments on both instruments. When a company pays interest on its debt instruments, it can use the following double entry.
The company can then make the payment to the lender as usual. However, once the other party calculates the interest rate, the company must adjust the interest expense. When the other party's interest is lower, the company will record the receipt for the difference. In that case, the double-entry will be as follows.
However, if the other party’s interest expense is higher, the company has to pay the net difference. In that case, the adjustment will be as follows.
The company must also calculate any changes in the fair value of the debt and record it. If there is an increase in its value, it can use the following double entry.
In case of a loss, it can use the reverse of the above entry. ConclusionAn interest rate swap is a contract that involves the exchange of one type of interest payment for another. Usually, it includes the exchange of fixed-rate and floating-rate interest payments. There are two parties involved in an interest rate swap. With interest rate swaps, the involved parties don’t exchange the underlying debt instruments. Article Source Here: Interest Rate Swap The price-to-earnings ratio is among the most prominent metrics that investors use when making investment decisions. It is straightforward to calculate and also provides a tool for investors to compare various stocks. Another reason why investors prefer the P/E ratio is that they can use it in other useful ratios. One of these includes the P/E to Growth ratio. What is the P/E to Growth Ratio?The P/E to Growth ratio (PEG) considers a stock's P/E ratio and the growth rate of its earnings for a specific period. The PEG ratio enhances the P/E ratio by considering any estimated growth in a company's income. It is one of the limitations of the P/E ratio, which the PEG ratio addresses. Through the PEG ratio, investors can get valuable insights into a stock's level of valuation. How to calculate the P/E to Growth Ratio?Investors can use the following formula to calculate a company’s P/E to Growth ratio. P/E to Growth Ratio = P/E Ratio / EPS Growth Similarly, investors can expand the formula as follows. P/E to Growth Ratio = (Price / EPS) / EPS Growth Usually, calculating the P/E ratio is straightforward. It is also available on most stock markets for publicly-listed companies. However, obtaining an accurate EPS growth rate for a specific stock may be difficult. Investors can get these estimates from specialized sources for publicly-listed companies. Once they have both the figures, they can easily calculate the PEG ratio for the stock. ExampleAn investor wants to decide between investing in two stocks. The first stock is from Red Co., which has a market price of $100. The company’s EPS in the previous accounting period was $25 per share. Stock analysts believe that the EPS will grow by 20% in the next period. Red Co.’s P/E ratio is as below. P/E Ratio = Current Share Market Price / Earnings Per Share P/E Ratio = $100 / $25 P/E Ratio = 4 Similarly, Red Co.’s P/E to growth ratio will be as below. P/E to Growth Ratio = P/E Ratio / EPS Growth P/E to Growth Ratio = 4 / 20 P/E to Growth Ratio = 0.2 On the other hand, the investor has the option to invest in Blue Co.’s stock as well. Blue Co.’s current stock price in the market is $100 as well. Similarly, its EPS for the last period was $32. Market analysts believe the company’s EPS will grow by 10% in the next period. Therefore, the company’s P/E ratio is as below. P/E Ratio = Current Share Market Price / Earnings Per Share P/E Ratio = $100 / $32 P/E Ratio = 3.125 Similarly, Blue Co.’s PEG ratio is as below. P/E to Growth Ratio = P/E Ratio / EPS Growth P/E to Growth Ratio = 3.125 / 10 P/E to Growth Ratio = 0.3125 Some investors may prefer investing in Red Co.'s stocks due to the lower P/E ratio. However, according to the PEG ratio, Blue Co.'s stocks have a better potential for growth. Regardless, investors must understand that the PEG ratio depends on the accuracy of the forecasted EPS growth. ConclusionP/E ratio is a widely used financial metric that allows investors to make decisions between investments in stocks. However, it fails to reflect the potential growth in earnings in the future. That is where the P/E to growth ratio is useful. The PEG ratio considers the relationship between a stock's P/E ratio and its growth rate. Post Source Here: P/E to Growth Ratio (PEG) The Price-To-Earnings ratio is an essential ratio for investors and measures a stock's price in relation to the underlying company's earnings. Other names for it are price or earnings multiple. P/E ratios are a critical comparison tool used by investors to evaluate various investments. There are different types of P/E ratios, which consider several aspects of a company's P/E. One of those includes the forward P/E. What is a Forward P/E?The Forward Price-to-Earnings uses a company's forecasted earnings to calculate the P/E ratio rather than its historical profits. Usually, investors forecast a company's earnings per share for the next 12 months and use it as a part of the original P/E ratio. Other names for the forward P/E include the project or leading P/E. The accuracy of the forward P/E depends on the forecast made by the investor. Forward P/E ratios can be effective in evaluating a company. For most investors, the forward P/E is more useful than using historical information. Investors may use several techniques to forecast a company's earnings to use with the forward P/E ratio. The formula for the forward P/E stays the same as the original one. The only difference is using expected earnings instead of historical information. How to calculate Forward P/E?The formula to calculate a company’s P/E ratio is as below. Price-to-Earnings Ratio = Current Share Market Price / Earnings Per Share Information about a company’s current share market price is available through the stock market. However, for private companies, obtaining an accurate price may be challenging. Similarly, a company’s Earnings Per Share is available in its Income Statement. Investors can also calculate it using the information available in the company’s financial statements. As mentioned, the formula for the Forward P/E is similar to that of the original P/E ratio. However, investors use a company's forecasted earnings per share. Therefore, the formula will become: Forward Price-to-Earnings Ratio = Current Share Market Price / Estimate Future Earnings Per Share ExampleAn investor wants to calculate the forward P/E for a company, Red Co. The company’s shares are publicly available in the stock market with a current market price of $100 per share. Red Co.’s earnings per share in the previous period were $20 per share. However, market analysts estimate the company’s EPS to reach $25 per share in the future. Red Co.'s P/E ratio, based on its historical EPS, is as below. Price-to-Earnings Ratio = Current Share Market Price / Earnings Per Share Price-to-Earnings Ratio = $100 / $20 Price-to-Earnings Ratio = 5 On the other hand, Red Co.’s forward P/E will be as below. Forward Price-to-Earnings Ratio = Current Share Market Price / Estimate Future Earnings Per Share Forward Price-to-Earnings Ratio = $100 / $25 Forward Price-to-Earnings Ratio = 4 How does Forward P/E work?Forward P/E uses a company’s estimated earnings rather than its historical profits. When investors acquire stocks, they cannot earn from past performance. However, they can benefit in the future. Hence, it is more relevant for them to consider their future profits. Therefore, the forward P/E provides a better measure of the potential earnings the investors can make. Other than that, the forward P/E ratio works in a similar way to the trailing P/E ratio. Investors can use it to compare various stocks and make decisions accordingly. ConclusionForward P/E is a financial metric that looks at a stock's price and the future estimated earnings per share of the underlying company. The Forward P/E ratio is crucial for investors as it helps them in decision-making. The accuracy of the calculation depends on the forecast used to calculate the forward P/E. Originally Published Here: What is a Forward Price-To-Earnings (P/E) Ratio |
Archives
April 2023
|
 RSS Feed
