Derivative Valuation, Risk Management, Volatility Trading

|
In a previous post, we presented a time series analysis of the SP500 index and demonstrated its mean-reverting and trending behaviour. Subsequently, we designed trading strategies exploiting these mean-reverting and trending properties of SP500. Does this mean that the SP500, and stock market indices in general, can be predicted? In a recent publication [1], the author utilized multiple linear regression in order to study the predictability of the SP500 index. We note that, In statistics, linear regression is a linear approach to modelling the relationship between a scalar response and one or more explanatory variables (also known as dependent and independent variables). The case of one explanatory variable is called simple linear regression; for more than one, the process is called multiple linear regression. This term is distinct from multivariate linear regression, where multiple correlated dependent variables are predicted, rather than a single scalar variable. Read more The article concluded that by using relevant market variables, investors can accurately predict financial markets to a certain extent. In this study, we used multiple linear regression for the stock prediction of the SPX index. Here we created three different regression models on a daily, weekly, and monthly basis. The models obtained were used for predicting the closing price of the SPX index. Each model proved statistically significant. From the results of each model, we can conclude that our monthly model forecasted better than our weekly and daily models. The author also emphasized that the prediction is more accurate in the monthly timeframe than in the daily and weekly timeframes. We concluded that our monthly frame held the best adjusted AR 2 value of 0.95, meaning 95% of the variance in the closing price of the SPX is explained by our independent variables. Therefore, we conclude that investors and analysts must use higher-timeframe models to see general trends. Our forecasting error shows that our MAPE value for our best model is 5.2% whereas our worst model MAPE value is 5.6%. As such, our models underestimate by creating more negative errors where MPE = -0.45 and -0.48. When analyzing the results obtained from comparing our predicted line to our actual line, our models identify and follow the trend within the market index. Thus, we can conclude that the pricing model of the markets is predictable to a certain extent. This finding is consistent with the well-known observation that the markets are less noisy in the higher timeframe than in the lower one. Design your strategies accordingly. References [1] LT. Martinez, The Effective Predictors of the SPX Index, The Michigan Journal of Business, Volume XII, Issue I, 2021 Article Source Here: Can the SP500 Index be Predicted?
0 Comments
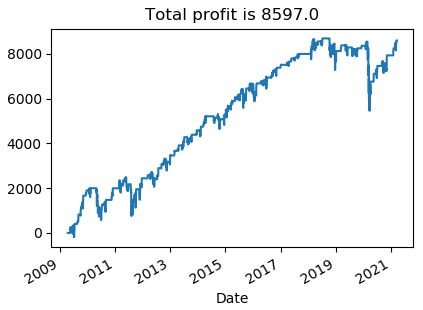
Interest rate swaps are a primary type of hedging method used by participants to mitigate their risks. With these swap contracts, participants can exchange their interest payments with another party to receive favourable terms in the future. There are several types of interest rate swaps that participants can use for that purpose. The most prevalent type of interest rate swaps includes exchanging floating and fixed interest payments. This way, one party gets to pay fixed interests, which is more secure and involves lower risks. If the interest rates in the market increase, the party responsible for fixed interest payments will be at an advantage. In contrast, the party with the floating rate interest payments can also benefit. However, the interest rates in the market must go down for that to happen. Interest rate swaps are complicated contracts. It is because each participant assumes responsibility for the other party’s interest payments. However, the debtholder is ultimately responsible for their own interest payments. The tax treatment for interest rate swaps can also be an area of confusion for both the involved parties. What is a Notional Principal Contract?Under the taxation rules, interest rate swaps fall under notional price contracts. It is a term of art used by the US federal income tax professionals. Notional price contracts describe contracts based on an underlying notional amount. In these contracts, neither party actually holds the property that comprises the underlying amount. As mentioned, with interest rate swaps, each party is ultimately responsible for its own debt payments. However, one party pays the other an amount after each period depending on the underlying notional amount. They do so by multiplying a floating and a fixed rate with the other party’s principal amount. For this reason, interest rate swaps fall under notional principal contracts. What is Interest Rate Swap tax treatment?The tax treatment of interest rate swaps is the same as notional price contracts. Any party involved in these contracts must recognize any amount under a swap contract in accordance with the rules governing the recognition of such payments. It may go against or override the party’s usual method of accounting for federal income tax purposes. Any party that receives an amount under interest rate swaps must recognize it as ordinary income. These amounts do not constitute capital gains for federal tax purposes. The source for this income is the residence of the recipient. For the party making the periodic payments under an interest rate swap, these payments constitute deductible expenses. Notional principal contracts may also come with nonperiodic payments, which are different from periodic payments. These payments are recognized over the term of a contract in a manner that reflects the contract’s economic substance. Each party must also treat nonperiodic payments as ordinary income or expense. Lastly, some notional principal contracts may have terminational payments associated with them. For these payments, each party must recognize a capital gain or loss if the contract is a capital asset for the taxpayer. Each party must recognize any termination payments in the year of the extinguishment, assignment, or exchange. ConclusionInterest rate swaps allow participants to exchange their interest payments with another party. For taxation purposes, interest rate swaps meet the definition of notional principal contracts. Therefore, the taxation treatments for interest rate swaps are the same as notional principal contracts. Article Source Here: Interest Rate Swap Tax Treatment Investors have many options when it comes to investing in bonds. Usually, investors can get bonds directly from the issuer. These issuers may include municipalities, government agencies, or companies. On the other hand, investors can also invest in funds that offer convertible bond investments. Among these investments, investors can choose to include convertible bond funds in their portfolio. What are Convertible Bonds?Convertible bonds allow the holder to convert their bonds into the issuing company's equity in the future. These bonds are a type of hybrid security that has characteristics of both debt and equity finance. The equity characteristic comes from the option to convert the bonds into equity in the future. The debt characteristic is inherent to the bond, similar to traditional bonds. In essence, convertible bonds are debt instruments. It is because these bonds come with a face value, a maturity date, a coupon rate, etc. These are all characteristics that are common to all traditional bonds. The equity component is only applicable if the investor or bondholder chooses to convert their investment into equity. Apart from the terms associated with traditional bonds, convertible bonds also come with conversion terms. These usually include the number of shares that investors can get for each unit of conversion. For example, a convertible bond may come with the option to convert each $100 of bond face value to 5 ordinary shares. What is a Convertible Bond Fund?Convertible bonds aren't as common as other types of bonds. However, these are still significant as they consist of an element of both equity and debt. For investors, convertible bonds are important as these come with a call option. For the issuing company, convertible bonds mean a potential increase in future equity balances and dilution of control. Stable companies don’t usually issue convertible bonds. Only companies that have a low credit rating but come with a high growth potential use convertible bonds. It makes identifying and investing convertible bonds complicated for convertible bond investors. Therefore, investors can simply invest in convertible bond funds. Convertible bond funds represent a pool of funds from investors that want to invest in convertible instruments. These usually come in the form of mutual funds and have all the characteristics of mutual funds. However, the underlying investment for convertible bond funds is any bonds that come with a convert option. What are the advantages and disadvantages of Convertible Bond Funds?Convertible bond funds allow investors to focus their investments on convertible bonds only. Usually, there is a manager who manages these investments. Therefore, investors don't need to manage their investments actively. Similarly, investors have the option to convert their bonds at maturity. It allows them to significantly increase their wealth if a company experiences growth during the bond period. However, convertible bond funds come with some disadvantages. By allowing managers to manage these funds, investors lose control of their investment. Similarly, there are some fees and expenses associated with convertible bond funds. On top of that, convertible bonds usually come from companies that a low credit rating. Therefore, these can prove to be high-risk investments. ConclusionConvertible bonds are debt instruments that also have equity instrument characteristics. These are bonds that allow investors to convert their bonds into ordinary shares. Investors can pool their funds and invest in convertible bond funds. Usually, these are mutual funds that enable investors to invest in several convertible bonds. Post Source Here: What Is A Convertible Bond Fund What is the Bird in Hand Theory?The bird-in-hand theory suggests that investors would prefer dividends from stock investments over capital gains. This theory believes that investors are likely to favour returns that are certain rather than uncertain. Because of the uncertainty involved around capital gains, the bird-in-hand theory assumes investors will always prioritize dividend investments. The bird-in-hand theory comes from the old saying, "a bird in hand is worth two in the bush". Therefore, this theory believes that investors prefer dividend investments because they are more secure than capital gains. Similarly, the theory suggests that even though capital gain investments may promise higher returns in the future, investors are likely to ignore them in favour of safer returns. Where does the Bird in Hand Theory originate from?Developed by Myron Gordon and John Lintner, the bird-in-hand theory opposes the dividend irrelevance theory. The dividend irrelevance theory suggests that dividends don't have any effect on a company's stock price. The irrelevance theory also proposes that investors are indifferent to whether they get returns from dividends or capital gains. However, the bird-in-hand theory opposes the view by suggesting that dividends affect a company's stock price. Similarly, it says that dividend payments also affect investors' behaviours. The premise behind the bird-in-hand theory is that low dividend payouts lead to an increase in a company's cost of capital. Therefore, a higher dividend payout rate increases a company's stock price. How does the Bird in Hand theory affect investors’ decision making?When it comes to capital gains, investors have to face a significant amount of uncertainty. There is no metric that can reliably estimate how much capital gain a specific stock will experience. A stock's ultimate capital gain performance depends on several factors. Some of these factors are unpredictable and outside a company's control. Therefore, capital gains investing can face investors with uncertain conditions and returns. For the substantial risks that investors face, they also get higher rewards. However, the risks may also result in significantly low or no returns at all. For some investors, the risks may not be acceptable for the returns they get. The bird-in-hand theory works on that idea. It suggests that investors are more likely to choose safer investments rather than risky ones. Compared to capital gains, dividends are easier to predict and calculate. They also represent lower risks for investors. However, they also come with lower returns, which are significantly lower than capital gains sometimes. What are the limitations of the Bird in Hand Theory?The bird-in-hand theory goes against the idea that investors want to maximize their profits. By suggesting that investors will ignore high capital gains for dividends, this theory may offer higher security. However, it does not allow investors to maximize their returns. In the short-term, some investors may benefit from dividend investing. However, capital gains will almost always exceed any returns from dividends received in the long run. ConclusionThe bird-in-hand theory states that investors prefer dividends returns rather than capital gains when investing in stocks. It is because it believes that investors are more likely to favour safer returns compared to uncertain earnings. The bird-in-hand theory opposes the dividend irrelevance theory, which suggests dividends do not impact a company's stock price. Post Source Here: The Bird in Hand Theory Hedge funds represent alternative investments where investors pool funds and employ different strategies. The goal with hedge funds, as with any other investment, is to earn active returns. Hedge fund managers gather funds from investors and invest them according to a promised strategy. However, hedge funds are mostly available to affluent investors only. In exchange for managing hedge funds, hedge fund managers get paid by the investors. Usually, their payments include a combination of fixed and performance-based fees. This structure allows managers to benefit from making the right decisions while also getting compensated for their management. There are two benchmarks that hedge funds can use to collect incentive or performance-based fees from investors. These include the high-water mark and the hurdle rate. What is High-Water Mark in Hedge Funds?A high-water mark represents the highest peak that investments have reached in value. The high-water mark in hedge funds shows the peak value that the funds achieve since their initial establishment. Hedge funds use the high-water mark as a measure for incentives for fund managers. However, it can also work as a protection for investors. As mentioned, hedge funds include both fixed and performance-based fees for managers. Usually, these include 20% of the profits the managers help generate for investors. While it provides managers with an incentive to increase profits, it does not protect investors. Investors will want to establish a benchmark for managers below which they will not receive an incentive. Investors use the high-water mark as that benchmark. While hedge fund managers will receive a profit-based incentive, they only get it if the fund's total value exceeds the high-water mark. This way, managers don't get paid when they demonstrate poor market performance. Only if they succeed to increase profits beyond the high-water mark, they will receive an incentive. How does the High-Water Mark work in Hedge Funds?The high-water mark ensures that investors do not compensate hedge fund managers for poor performances. More importantly, however, it allows investors to avoid paying incentives twice for the same results. It is because investors will only pay for increases in hedge fund performance. If there is a drop or decrease in hedge fund value, investors can avoid paying a fee for subsequent increases. The high-water mark is similar in function to the hurdle rate. A hurdle rate in hedge funds represents the minimum amount of profits that managers must achieve to get performance-based incentives. However, managers cannot receive any incentives if the performance does not exceed the high-water mark level. It means that managers may still generate a minimum return on hedge funds and achieve the hurdle rate. However, the high water-mark is more important. What are the advantages and disadvantages of High-Water Mark?A high-water mark provides an incentive for managers. With a high-water mark level in place, hedge fund managers must perform at a level to increase the fund's performance. However, the high-water mark is ultimately more beneficial to investors. Not only does it help them maximize their wealth, but it protects them as well. It does so in two ways. Firstly, it protects investors against paying for poor performances. Similarly, it helps them avoid paying double incentives. However, setting an unrealistic high-water mark level can also be demotivating for managers. If managers can't achieve the level despite their maximizing profits, it can have an adverse effect. Similarly, the high-water mark can expose investors to significantly high risks. When trying to achieve the high-water mark level, managers may take unnecessary risks that can cause significant losses. ConclusionHedge funds are fund pools where managers collect funds from investors and invest them according to a specific strategy. Hedge funds come with two benchmarks for management incentives, which include high-water mark and hurdle rate. The high-water mark represents the highest peak that a hedge fund performance must reach in value for managers to receive incentives. Originally Published Here: High-Water Mark in Hedge Funds In a previous post, we demonstrated the mean-reverting and trending properties of SP500. In this follow-up post, we will develop a simple trading system exploiting the mean-reverting behaviour of this market index. To generate buy and sell signals, we will use simple moving averages as noise filters. The simple moving average takes an average value of a stock over a certain period of time. It has been used for decades by technical traders and investors around the world. There exist other types of moving averages such as exponential moving averages, but we will use the simple ones in this post. Since we know that the SP500 is mean-reverting in a short term, we will use short-term moving averages. The trading rules are as follows, If 3-day simple moving average < 20-day simple moving average, buy $10000 worth of stock Exit if 3-day simple moving average >= 20-day simple moving average We downloaded SPY data from Yahoo Finance and implemented the above trading rules in a Python program. The picture below shows the equity line of the strategy. We note that using the 3- and 20-day simple moving averages the strategy is overall profitable.
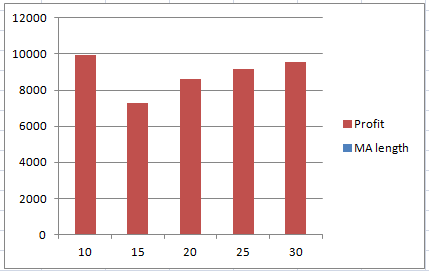
Next, we proceed to test the robustness of this system. To do so, we vary the length of the second moving averages (20 days in the previous example). The graph below shows the total PnL as a function of the length of the second moving average. We observe that the overall profit remains positive when we change the length of the moving average. This would indicate that the strategy performance is stable in this parameter regime.
In summary, we developed a simple trading strategy exploiting the mean-reverting behavior of SP500. In the next installment, we will design a trend-following system on this market index. Click on the link below to download the Python program Post Source Here: Mean-Reverting Trading System-Quantitative Trading in Python Default risk is a type of risk that accompanies all debt obligations. Default risk represents the uncertainty associated with repayments from borrowers. In case these risks realize, lenders can suffer a substantial amount of losses. Therefore, they need to protect against such occurrences. Usually, lenders check the borrower's creditworthiness to decide on providing the loan. What is a Credit Rating?A credit rating is a quantification of an individual or company's creditworthiness. Lenders may use creditworthiness to evaluate the default risk of a particular borrower. Most lenders require borrowers to have a history of past credit transactions, based on which they can calculate their credit rating. Usually, credit ratings apply to both individuals and organizations. Credit ratings mostly come from credit rating agencies. Therefore, the credit rating signifies the agency's opinion of the borrower's creditworthiness. Despite its many uses, a credit rating that comes from these agencies can have some limitations. For example, they may not address a particular issue that lenders want to consider. What is Internal Credit Rating System?An internal credit rating system describes a borrower’s creditworthiness for a particular sector or industry. Usually, this system bases the calculation on the assessment criteria for the sector or industry in question. Through an internal rating system, lenders can manage and control their credit risks by grouping and managing borrowers’ creditworthiness and quality of credit transactions. Internal credit rating systems analyze a borrower's ability to repay a loan based on their financial condition. These may include factors, such as determining their cash flows, profitability, debt profile, industry and operational background, liquidity, etc. For most banks, an internal credit rating system is a crucial part of their credit risk management process. In the past, lenders managed their credit risks by evaluating a borrower’s creditworthiness only. Due to several financial crises, however, they realized the system was ineffective in preventing losses. Therefore, more lenders started adopting internal credit rating systems. It made the process of decision-making simpler while also minimizing loss occurrences. What are the advantages of using the Internal Credit Rating System?Using an internal credit rating system can have several advantages for lenders. Firstly, it allows for a more efficient decision-making process while minimizing the administrative burden. It also considers various factors and combines them into a single measure, making it easier to understand. An internal credit rating system can also help lenders develop credit management strategies, such as establishing lending rates. More importantly, an internal credit rating system allows lenders to get more specific information about borrowers. It allows lenders to customize the process of evaluating a borrower's creditworthiness according to their requirements. Overall, an internal credit rating system can provide lenders with a basis for a consistent, comprehensive, and objective credit management process. What are the uses of the Internal Credit Rating System?Internal credit rating systems have several use cases for lenders. Firstly, they can help lenders establish credit limits based on rating grades. By setting rating grades, lenders can also determine which loans will need active monitoring. This way, they can avoid any unexpected circumstances in the future. Similarly, an internal credit system can help in establishing a PD for each grade. They can then use this to quantify the credit risk and in other further calculations. ConclusionCredit rating is a term used to describe a borrower’s creditworthiness in quantitative form. Lenders may use an internal credit rating system when making decisions. With this system, they can analyze a borrower’s ability to repay based on their financial situation. Similarly, they can use it to describe a borrower’s creditworthiness for a specific sector and establish rating grades for borrowers. Originally Published Here: Internal Credit Rating System What is an Expected Credit Loss?The term expected credit loss represents the amount of loss the companies estimate to have on their credits. It is a term used in accounting under the IFRS 9. Before the expected credit losses, companies recognized bad debts or credit losses only when they occurred. However, with IFRS 9, companies must account for expected credit losses as well. With expected credit losses, companies must look at how their current and future economic conditions affect the value of expected losses. While some may consider credit losses to be an issue for financial institutions or lenders only, they also apply to businesses. Therefore, any company that makes credit sales and accumulates account receivable balances must deal with expected credit losses. Expected credit loss represents the probability-weight estimate of credit losses over a financial instrument's lifecycle. The losses come in the form of the present value of any cash shortfalls. Cash shortfalls represent the difference between cash flows due in accordance with the contract and the cash flow that a company expects to receive. What is the Expected Credit Loss formula?The IFRS 9 standard does not provide a specific method to calculate expected credit losses. However, companies can use the probability of default approach to calculate it. This approach considers the exposure at default, probability of default, and loss given default of a particular instrument. Most financial institutions calculate it as a part of their internal risk management. Exposure at DefaultExposure at default is the value of the financial asset exposed to credit risk. It is the amount at risk at the time when the company expects the default to occur after deducting the value of any collateral. Exposure at default does not represent the carrying value of a financial asset. Probability of DefaultProbability of Default shows the chances of default from a borrower over a specific period of time. Usually, the higher the credit period is, the higher the probability of default will be as well. Loss Given DefaultLoss given default shows the percentage of the amount that the lender expects to lose in case of a default. It is the opposite of the recovery rate that lenders can expect from a loan. Expected Credit Loss CalculationCompanies will need to establish various scenarios and calculate the probability of default and loss given default for each of them. Once they do so, they must determine the total loss for each scenario, which would be equal to the product of exposure at risk and loss given default. They must then calculate the weighted-average expected loss. The weighted-average expected loss is the product of the total loss and probabilities of default for each scenario. Lastly, companies must discount the expected credit losses at the effective interest rate of the financial asset in consideration. The final form for the expected credit loss formula will be as follows. Expected Credit Loss = [EAD x (LGD1 x PD1 + LGD2 x PD2 + … + LGDn x PDn)] / (1 + r)n In the above formula, EAD represents exposure at default, LGD is the loss given default, and PD is the probability of default. 'n' denotes the number of scenarios for which companies calculate the above three. ConclusionExpected credit loss represents the amount of loss that companies may estimate to have on their credits. Usually, it applies to accounts receivable balances as these are financial instruments. Companies can calculate the expected credit loss using the probability of default approach, as shown above. Originally Published Here: Expected Credit Loss Formula Default risk represents the chance that a borrower does not repay their debt obligation. Almost every loan or debt obligation comes with default risk. The higher the default risk is, the more unlikely it is for lenders to recover their loaned amount. Default risks can be crucial for lenders when deciding on whether to provide a loan or not. There are various precautions that lenders or investors may take to mitigate default risks on their loans. While these steps may decrease the default chances, they do no eliminate those risks. Therefore, defaults on loans are always possible and cause losses for the lender. A term often associated with these losses is the loss given default. What is Loss Given Default?Loss given default (LGD) refers to the amount of money that financial institutions lose when a borrower fails to repay a loan. Usually, they calculate it as a percentage of the total exposure at the time of default. Loan given default is a common metric used for calculating a lender’s expected losses when making decisions about loan provision. There are several factors that may dictate the chances of defaults by borrowers. Usually, the borrower's credit rating can indicate whether they will repay the loan or not. Similarly, any ongoing financial crisis may significantly increase the probability of defaults by borrowers. When these chances are high, the loss given default of the lender will also be high. What is the Loss Given Default formula?Measuring the loss given default for a particular loan is crucial for lenders. They can calculate the LGD in one of two ways. Firstly, they can use the loss given default formula below. Loss Given Default = Total Loss / Total Loan Value x 100 In the above formula, the total loss represents the loan value after deducting the amount recovered. Similarly, the total loan value represents the amount of loan that the lender provided. The loss given default of debt also depends on its recovery rate. The higher the recovery rate of a loan is, the lower its loss given default will be and vice versa. Since both of these are a percentage of the total amount of loan provided, lenders can also use the recovery rate to calculate the loss given default. They can use the following formula to do so. Loss Given Default = 1 - Recovery Rate ExampleAn investor provides a loan of $100,000 to a company. The company repays $80,000 of the debt. However, it fails to repay the remaining amount and defaults on the payment. Therefore, the loss given default for the investor will be as follows. Loss Given Default = Total Loss / Total Loan Value x 100 Loss Given Default = ($100,000 - $80,000) / $100,000 x 100 Loss Given Default = 20% Similarly, the loan’s recovery rate will be 80% as the investor only lost 20% of the loan due to default. What is the importance of Loss Given Default?Loss given default is crucial for lenders for several reasons. Firstly, it is useful in the calculation of expected loss, economic capital, and regulatory capital. Lenders can also use the LGD in various models, such as the Basel Model. If used properly, LGD can help lenders forecast any possible defaults and work towards maximizing recoverability. ConclusionLoss given default is a term used to describe the amount of money that lenders lose in case of a default from the borrower. Lenders can calculate the LGD as a percentage of the total value of the loan they provide. There are two loss given default formulas that they can use to do so, both of which are easy to use. Originally Published Here: Loss Given Default Formula What is Net Operating Profit After Tax?Net Operating Profit After Tax (NOPAT) is a term that shows a company’s income from operations without considering interests. Since the interest payments for different companies depend on their capital structure, comparisons between them can be challenging. However, NOPAT removes the effects of interest payments from a company’s operations to allow better comparability. NOPAT is a financial metric that investors can use to evaluate a company's operations. Without the impact of interest, investors can determine how the company has performed due to its core operations. Since the capital structure of companies may differ, NOPAT can provide a better indicator of operational efficiency. How to calculate Net Operating Profit After Tax?As mentioned, net operating profit after tax shows a company's earnings by excluding any interest expenses from it. However, the calculation of NOPAT isn't as straightforward as adding interest expenses back to a company's net income. It is because there may be some tax implications associated with interest payments as well. Investors can use one of the two formulas below to calculate a target company’s net operating profit after tax. Net Operating Profit After Tax = Operating Income (or Income from Operations) x (1 - Tax Rate) The above formula calculates the net operating profit after tax by not including interest while also accounting for taxes. It uses operating income that is generally available in a company’s income statement. Similarly, investors can use the formula below, which may need more information for NOPAT calculation. Net Operating Profit After Tax = (Net Income + Interest Income + Tax + Non-Operating Gains or Losses) x (1 - Tax Rate) The above formula also provides the same net operating profit after tax. However, it adds the company's tax and interest expenses back to its net income. It also adds any non-operating gains or losses to the net income. Lastly, it removes the effect of taxation from the residual amount to reach the NOPAT. The information necessary to calculate the NOPAT using the above formula is also available in the income statement. ExampleA company, Red Co., reported a net income of $200,000 during the last financial period. It also showed an interest expense of $30,000, tax expense of $25,000, and non-operating losses of $20,000. Red Co. pays a corporation tax of 20%. Therefore, its net operating profit after tax will be as follows. Net Operating Profit After Tax = (Net Income + Interest Income + Tax + Non-Operating Gains or Losses) x (1 - Tax Rate) Net Operating Profit After Tax = ($200,000 + $30,000 + $25,000 + $20,000) x (1 - 20%) Net Operating Profit After Tax = $125,000 x 80% Net Operating Profit After Tax = $100,000 What is the importance of Net Operating Profit After Tax?Net operating profit after tax is useful in various calculations. It can help investors in calculating economic value added (EVA) or unleveled free cash flow. It also allows investors to compare companies with different capital structures. Some experts consider NOPAT to be a better measure of a company's performance than its net income. NOPAT is also useful in acquisitions and mergers as a company's capital structure is likely to change significantly after them. ConclusionNet operating profit after tax considers a company’s income after taking out the effects of interest payments. It is useful for comparisons between companies of varying capital structures. Investors can calculate a company’s NOPAT using the information provided in its income statement. Post Source Here: Net Operating Profit After Tax |
Archives
April 2023
|
 RSS Feed
