Derivative Valuation, Risk Management, Volatility Trading

|
A tool that investors commonly use to determine the direction of a trend is the moving average. It shows a summary of the data points of financial securities over a specific time. Similarly, it calculates the average for it by dividing the total by the number of data points. The reason it is called moving average is that it continuously changes because the average is recalculated based on the latest price data. In investing, a moving average is common when it comes to the technical analysis of a stock. Investors use it to help smooth out the price data by calculating an average price continually. It eliminates the impact of any random or short-term fluctuations in the price of a stock over the specified time. Similarly, investors can use the moving average to identify support or resistance by evaluating the movements in a stock's price. Types of Moving AveragesThere are two main types of moving averages that investors can use. These are as follows. Simple Moving AverageThe simple moving average, as the name suggests, is a basic type of moving average. It only considers the recent data points in a given set and divides the total by the number of time periods. Investors use it to determine when to enter or exit a market. Simple moving average only considers historical data. Investors can calculate it for different types of prices, i.e., low, high, open, and close. The formula to calculate the simple moving average is as follows. Simple moving average = A1 + A2 + … + An / n In the above formula, 'A' represents the average for each period, while 'n' denotes the number of periods. Exponential Moving AverageThe exponential moving average is more complicated compared to the simple method. It gives more preference to the most contemporary price points to make the moving average more responsive to them. Therefore, it is more responsive to the recent price change in the market. However, calculating the exponential moving average requires more work. To calculate the exponential moving average, investors need to start with the simple moving average for the period. Similarly, they need to calculate the 'multiplier' for weighting the exponential moving average using the formula: [2 / (selected time period + 1)]. Using those, the investor can calculate the current exponential moving average. The formula for the calculation is as below. Current Exponential Moving Average = [Closing Price - EMA previous time period] x Multiplier + EMA previous time period Why is Moving Average important?Moving average is a crucial concept in capital markets for technical analysis of the prices of a stock. Using moving average, investors and analysts can identify any trends in them. They may also use the moving average as lagged indicators as it uses historical information and, therefore, the averages cannot exceed the closing prices. Lastly, moving averages also assist in the calculation of support and resistance level in technical charts. ConclusionMoving average is a tool used by investors to define the direction of a trend. There are two types of moving trends that they can use, the Simple Moving Average and the Exponential Moving Average. Both of these produce different results. Overall, moving averages have significant importance, as discussed above. Article Source Here: Formula for Moving Average
0 Comments
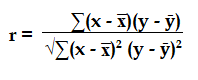
Correlation analysis is a tool used to test the relationship between various variables, either quantitative or categorical. It measures how these variables affect each other. Through analyzing the correlation between different variables, making predictions or estimates on future behaviours becomes less complex. When it comes to investing and finance, correlation analysis is the study of how two securities fluctuate in relation to each other. Correlation is an important concept used in advanced portfolio management. Usually, correlation analysis consists of establishing a 'correlation coefficient' which ranges between -1.0 and +1.0. Investors can also determine a benchmark index and perform correlation analysis with respect to it. What does Correlation signify?Correlation signifies how strong the relationship between two quantitative variables through the correlation coefficient. As mentioned above, the correlation coefficient can range from -1.0 to +1.0. A +1.0 coefficient shows a perfect positive correlation. It means that the relationship between the two securities is the strongest. When one security fluctuates, the other security will also follow the exact trend in the same direction. In contrast, the -1.0 correlation signifies a perfect negative correlation. Here, the correlation is in the opposite direction. Therefore, when one security fluctuates, the other security will also have the same fluctuation but in the opposite direction. For example, if one security goes up, the other will go down. Lastly, a zero correlation shows no correlation at all. How to calculate the Correlation Coefficient?Investors can use the formula below to calculate the correlation between two variables.
In the above formula, 'r' represents the correlation coefficient. 'x' denotes the value of the first variable in consideration. 'x̅' indicates the average observations of the first variable. Similarly, 'y' and 'ȳ' show the value of the second variable and its average observations, respectively. Investors need to follow a few steps when calculating the correlation coefficient. Firstly, they need to obtain a data sample with two variables, which will represent 'x' and 'y'. Similarly, they need to calculate the average or mean for both variables. These will constitute 'x̅' and 'ȳ'. Then they can subtract the mean values from both variables for the formula. After subtracting both means from their respective variables, investors will need to multiply the residual amounts with each other and find the sum of these multiplications. For the denominator, they will also need to square both of them before calculating the sum. After calculating it, they can square root it and obtain the value of the denominator. Finally, they can divide the nominator by the denominator to calculate the correlation coefficient. ExampleAn investor wanting to track the performance of a specific index, for example, Nasdaq Composite, wants to calculate if investing in a company will increase their systematic risk. The investor calculates the correlation coefficient between the stock and the index to be +0.90. It means that the stock has a high positive correlation with the index. Based on this, the investor understands that the high positive correlation will result in an increase in the systematic risk of their portfolio. ConclusionCorrelation analysis is the method of testing the relationship between various variables. In investing, investors use it to calculate the correlation of various securities or stocks. Usually, they may calculate the correlation coefficient between a stock and a specific index. Originally Published Here: What is Correlation Analysis Last month, efinancialcarreeers published a post, stating that quant’s life is getting harder these days. Back in the day, a quant in finance could devise a strategy, sit back and let the money roll in while lounging about in a silk robe with a fat cigar. Such are the halcyon dreams of the contemporary quantitative finance type who finds him/herself forced to grind continuously in front of a screen in search of illusory alpha while every man/woman with a piece of Python code does the same. This wasn't the exact complaint at today's Quant Conference (held digitally this year), but it came close. Read more
A week later, they published another post. This time it told the story of a former hedge fund IT professional who is trying to commoditize the systematic trading software market. Our mission is to commoditize high-performance systematic trading software," says Bogdan Donca. "This software is built over and over by both the buy-side and the sell-side and it has a high degree of reuse. We’ve created an off-the-shelf product for systematic hedge funds.” ... He says software is a factor in alpha generation. "Your success as a systematic hedge fund is partly about how quickly you can iterate trading strategy ideas. There is no Holy Grail and there is no single strategy – it’s about iteration and deploying test strategies and this requires software engineering excellence.” Read more The latter article implies that big hedge funds and investment banks still have an edge by using software and data, and that quant’s life is still easy. Don’t you think that these 2 articles are contradictory? So is quant’s life hard or easy? Let us know your opinion. Originally Published Here: Is Quant’s Life Hard or Easy? The yield curve is a line that shows the yields of bonds that have different maturities. It helps investors graph the yields of multiple bonds to estimate future interest rate changes and economic activity. When it comes to the curves plotted on the graph, investors can get three shapes. The first shape is an upward sloping curve, also known as a normal curve. The second type is the inverted or downward-sloping curve. Lastly, it may also result in a flat line. Investors use yield curves as a benchmark tool for other types of debt in the market. A normal yield curve occurs when longer maturity bonds have higher yields as compared to short-term ones. It is an indicator of future economic growth. On the other hand, an inverted curve indicates shorter-term yields having higher yields compared to longer-term ones. It may point to an economic recession in the future. Lastly, a flat yield curve is one where shorter- and longer-term yields have similar characteristics. It usually shows an economic transition. Through these yield curves, investors can base their decisions on whether they should invest in long- or short-term investments. What are the factors that influence the Yield Curve?Several factors may play a role in assigning the direction or type of the yield curve. Some of these include the following. InflationInflation is one of the primary influencers of the yield curve. Its because an increase in inflation causes higher interest rates and also results in lower purchasing power. Therefore, inflation may cause an increase in short-term interest rates. Interest ratesAs stated above, the interest rate also plays a role in giving the yield curve a shape. Interest rates increase the demand for treasuries, which can cause a fluctuation in interest rates. Economic growthSimilarly, economic growth also influences the yield curve. Economic growth can impact inflation and interest rates. An increase in economic growth leads to a rise in yields which steepens the yield curve. Why is the Yield Curve important?The yield curve is crucial for several reasons. Firstly, it helps investors estimate or forecast interest rates. It is because the yield curve allows investors to anticipate the future course of interest rates. Similarly, the yield curve can help investors identify overvalued or undervalued securities. For example, if securities or bonds lie above the yield curve, it indicates it is underpriced and vice versa. The yield curve can also indicate the difference between the borrowing and lending rates of financial institutions. Usually, an upward and steep yield curve shows a larger difference between the borrowing and lending rates, which results in higher profits for the banks. Furthermore, the yield curve also helps investors determine the relationship between maturity and yield. Lastly, investors can use the yield curve to develop a trading strategy. For example, investors can buy a long-term bond and sell it before its maturity to profit from declining yield over its life. Through their trading strategy based on the yield curve, investors can maximize their capital gains. ConclusionThe yield curve is a line that shows the tradeoff between the yields and maturities of various bonds. It can help investors in their decision-making process and developing trading strategies. There are three main types of yield curves, upward sloping, downward sloping, and flat. Post Source Here: Yield Curve of Bond The Price-to-Cash flow (P/CF) ratio is a metric that compares the prices of a company's stock with its operating cash flows. While it is not as popular as the Price-to-Earnings (P/E) ratio, it is still a valuable tool that investors have at their discretion. It is one of the many metrics that can help investors evaluate whether a company's stock is undervalued or overvalued for decision-making purposes. In its essence, the P/CF ratio calculates the current price of a stock relative to the amount of cash the underlying company generates from its operations. It works best for companies that have significant non-cash items on their Income Statements, such as depreciation, amortization, tax liabilities, etc. Some experts believe the P/CF ratio is a better indicator of investment valuation compared to the P/E ratio. How to calculate the Price-to-Cash Flow ratio?There are two formulas that investors can use to calculate the Price-to-Cash Flow ratio of a company based on the available information. The first formula is as below. Price-to-Cash Flow ratio = Market price of a company's stock / Operating Cash Flows per share Alternatively, investors can also use the market capitalization of a company in the stock exchange to calculate the P/CF ratio. Price-to-Cash Flow ratio = Market Capitalization / Operating Cash Flows Whether investors use the former or latter method, the result will be the same. How do investors use the Price-to-Cash Flow ratio?The P/CF ratio, while useful, has limited usage. As mentioned above, the P/CF ratio is crucial in evaluating stocks of companies that have high non-cash expenses. Therefore, it allows investors to get a better picture of the company's operations instead of relying on other metrics. It is because companies, although in losses, may have positive operating cash inflows. Mostly, investors prefer a stock that has a low P/CF ratio. That is because it indicates a stock is undervalued. However, there isn't a benchmark or standard for how much it should be. In contrast, a high P/CF ratio may also indicate a company having higher future prospects. However, it may also be an indicator of overvalued stocks. What are the pros and cons of using the Price-to-Cash Flow ratio?Investors have to face several pros and cons when using the P/CF ratio. Firstly, it considers the cash flows of a company instead of its profits. Cash flows, as compared to profits, cannot be manipulated by a company's management to reach a favourable position. Similarly, using cash flows allows investors to use a more standardized figure for comparison as compared to earnings. Overall, ratios based on cash flows provide a better and more accurate picture of a company. There are also a few disadvantages of using the P/CF ratio. Firstly, there are various types of cash flows that investors can use to calculate the ratio, which may result in inconsistent results. Likewise, it neglects any non-cash items, which might have a role in the company's performance. ExampleA company with a market capitalization of $100 million and operating cash flows of $50 million will have a P/CF ratio as follows. Price-to-Cash Flow ratio = Market Capitalization / Operating Cash Flows Price-to-Cash Flow ratio = $100 million / $50 million Price-to-Cash Flow ratio = 2.00 ConclusionThe Price-to-Cash Flow ratio is an important metric used by investors to calculate the value of a stock. It provides investors with a more accurate picture of a company's stock as compared to other ratios such as the Price-to-Earnings ratio. Article Source Here: Price to Cash Flow Investors can use various ratios to calculate the value of their investments. Each of them illustrates a different aspect of the investment, which can help investors in their decision-making. Among these, one ratio is the price-to-book (P/B) ratio. What is the Price-to-Book Ratio?The price-to-book ratio is a comparison of the market value of the stocks of a company with its book value. The market value of the stocks is usually available in the stock market, while a company's book value is available in its financial statements. The book value of a company is the residual amount that is left when it repays all its liabilities from its assets. The P/B ratio is one of the favourite metrics of investors because it allows them to determine whether the stock of a company is undervalued. Similarly, it can help them identify overvalued stocks so they can avoid investing in them. Based on the ratio, investors can make decisions about their portfolios. How to calculate the Price-to-Book Ratio of a stock?Calculating the P/B ratio of a stock is straightforward. Investors can use the formula below to calculate it. Price-to-book ratio = Price per share of stock / Book value of company per share For public-listed companies, investors can obtain the market value per share of its stock from the stock exchange. For private companies, it may be difficult to determine the exact price. Similarly, they can calculate the book value of the company per share of a company by dividing its shareholders' equity by its total number of outstanding shares. What does the Price-to-Book Ratio signify?Based on every stock, the P/B ratio calculated by investors will be different. Firstly, a P/B ratio of one signifies that the value of the stock of the company is in line with its book value. In other words, it means the market value of the stock reflects the book value of the company. However, instances, where the P/B ratio of a stock is one, are rare. A P/B ratio that is greater than one means that the stock of the company is trading at a premium. Furthermore, it means the stock is overvalued. These are stocks that investors try to avoid as they may not provide returns in the future. In fact, they may result in losses when the market value of the stock settles down. A P/B ratio of lower than one is what investors try to look for. It signifies a stock that is undervalued or operating at a discount. These stocks represent a profit opportunity for investors. Sometimes, however, a P/B ratio below one may also signify a company with overstated assets value. Similarly, a low P/B ratio can also be an indicator of poor financial performance. ExampleA company, Fox Co., has total assets of $20 million and total liabilities of $15 million. Its total outstanding number of shares is 400,000. The market value of its stock in the stock market is $10 per share. Its P/B ratio is as follows. Price-to-book ratio = Price per share of stock / Book value of company per share Price-to-book ratio = $10 / [($20 million - $15 million) / 400,000 shares] Price-to-book ratio = 0.8 ConclusionInvestors use the Price-to-Book ratio of a stock to determine whether it is overpriced or underpriced. Based on the P/B ratio, they can make decisions regarding the investments. Usually, investors prefer it to be lower than one. Sometimes, however, it may also indicate other problems with the stock or the company. Originally Published Here: Price to Book Ratio The easiest method for investors to generate income from their investments is to invest in risk-free instruments. It allows investors to earn money without having to take risks. However, the returns on these investments are lower as compared to others. If investors want to make higher returns, they must accept the risk associated with other instruments. However, investors must also determine whether investing in other instruments will yield them higher returns as compared to risk-free instruments. Therefore, they must use what is known as the risk premium on their investments. What is Equity Risk Premium?Equity risk premium represents the difference between the returns on equity or stocks of a company and the risk-free rate of return. Usually, the risk-free rate of return is the return that investors get from government bonds as they, usually, have negligible risks. Another definition of equity risk premium is the excess amount of return that investors get from a stock above the risk-free rate of return. The equity risk premium of a stock depends on several factors. Firstly, it depends on the risk that investors are willing to take on an investment. The higher the risks they take, the more their equity risk premium will be. Similarly, it also depends on the risk-free rate of return. If government bonds have low returns, then the equity risk premium will increase. How to calculate Equity Risk Premium?The formula to calculate the equity risk premium of a stock is as below. Equity Risk Premium = Rate of return of the market - Risk-free rate of return As mentioned above, it takes two factors into consideration, the rate of return of the market and the risk-free rate of return. In this formula, investors can use the return of a specific index of the stock exchange as the rate of return of the market. Similarly, for the risk-free rate of return, investors can use the rate of long-term government securities. Investors can also calculate the equity risk premium of a stock by rearranging the Capital Asset Pricing Model formula. After rearrangement, the formula becomes: Equity Risk Premium = Beta x (Expected return of market - Risk-free rate of return) What are the benefits of using Equity Risk Premium?Equity risk premium can provide many advantages to investors. First, it is easy to use and calculate, which any investor can calculate. Similarly, it gives investors an idea of whether investing in stock will yield positive results. Furthermore, the equity risk premium is necessary and used in various models such as the Capital Asset Pricing Model, which can help in calculating the cost of capital. What are the limitations of Equity Risk Premium?Equity risk premium may also come with some limitations. These limitations come mainly due to the assumptions that investors make when calculating it. Based on these assumptions, investors can get inaccurate results. Overall, it may produce an inconsistent result for various investors calculating the equity risk premium of the same stock. ConclusionThe equity risk premium is the difference between the return investors expect from stock and the risk-free rate of return. It helps investors determine whether they should invest in a stock or not. The higher the risks investors are willing to take, the higher the equity risk premium they can expect. Post Source Here: Formula for Equity Risk Premium When it comes to evaluating companies, investors have many tools that they can use. Among these, two of the most common ones are Enterprise Value and Market Cap. Using these tools, investors can make better decisions. However, investors must understand what each of these is and when to use them. What is Enterprise Value?Enterprise Value (EV) is a measure of the value of a company, which in addition to its market cap, also considers other factors, such as its short- and long-term debt and its cash balance. While still useful to investors, EV is popular among companies that want to evaluate potential takeovers. Apart from that, investors can use EV in several financial ratios and calculations. The formula to calculate the Enterprise Value of a company is as below. Enterprise Value = Market cap + Long-term debt + Short-term debt - Cash and cash equivalents By considering the debt of a company, EV presents its theoretical takeover prices. Companies with lower debt will have a lower EV, thus, being more attractive to investors. It is because higher debts represent higher risks for investors and the company itself. Similarly, companies with low cash and cash equivalent reserves will have a higher EV. Therefore, the investment will be less attractive to investors. It is because low cash reserves represent higher risks. While many investors prefer using Enterprise Value compared to other metrics, it may have some limitations. For example, while it considers debt as risky, it fails to consider how the company is using the debt. Therefore, it may not be an accurate metric to use for companies that utilize their debt finance to a maximum. What is Market Cap?Market cap (or market capitalization) is a measure of a company's total outstanding stocks multiplied by its current market value. It is a simpler and much more straightforward way of evaluating a company. For most public-listed companies, the stock market already calculates the market cap. For private-listed companies, the calculation may require some extra effort. The formula to calculate the Market Cap of a company is as below. Market Cap = Total outstanding shares of the company x Market price of its share The market cap is also useful in determining the total value of a company in case of acquisitions or takeovers. In addition to it, the market cap can also help investors that want to invest in stocks based on the company's value. Usually, a higher market cap represents stable companies in which investors prefer to invest. Overall, it can help investors in determining the size of a company and in decision-making. However, the market cap also has its limitations. Most importantly, it does not consider other aspects of the company, which the Enterprise Value does. Similarly, since it reflects the market price of the shares of the company, it does not represent a company's intrinsic value. Therefore, it may lead to inaccurate evaluations, which can impact the decision-making of investors. ConclusionInvestors use various tools to calculate the value of the companies in which they want to invest. Among these are the Enterprise Value and Market Cap. Enterprise value is a measure of the value of a company that considers its market cap, debts, and cash balances. Market cap, on the other hand, is a measure of the company's value based on the number of its outstanding shares and the market value of each share. Originally Published Here: Enterprise Value vs Market Cap Market efficiency represents the degree of the relationship between the prices of commodities or items in a particular market to the information available in the market. Usually, an efficient market is one where the prices reflect all the available information in the market and do not have any inefficiencies. An efficient market is a theoretical concept in which market participants can make decisions without having to factor or compensate for unavailable information. Therefore, all commodities in an efficient market will always represent the latest and actual prices. Hence, these commodities are not undervalued or overvalued. What are some conditions for an efficient market?Apart from all information being available, there are other assumptions that the efficient market makes. For example, the concept assumes that there are no transaction costs associated with buying and selling commodities. Similarly, it believes that there is a large number of customers and suppliers that do not have the power to manipulate or dominate the market. Furthermore, an efficient market assumes that all products or services sold by all the suppliers within the market are homogeneous or identical. For newcomers or competition, an efficient market believes there are no barriers to entry or exit. In short, the concept assumes new businesses can enter the market and offer their products to customers without having to face any obstacles. Why is market efficiency important?Market efficiency does not exist anywhere in the world. However, that does not mean the concept is futile. First of all, market efficiency is a crucial part of many models or calculations. In the absence of the assumptions made by market efficiency, many of these models fail to work. These models are a critical part of the decision-making process of investors and companies around the globe. Furthermore, market efficiency creates a level ground for investors to make decisions. Similarly, it also eliminates the possibility of investors exploiting the price of different commodities to make a profit. Overall, market efficiency allows investors to make sensible choices. Likewise, it also helps market participants to benefit from uniform prices. What are the forms of market efficiency?While market efficiency may never come true, there are several degrees to which market efficiency may exist. These include the following. Strong efficiencyStrong market efficiency is when all the assumptions of an efficient market apply. It represents the strongest or purest form of market efficiency. The strong form of market efficiency is the most difficult to attain. Semi-strong efficiencySemi-strong efficiency represents a market where the prices of commodities in a market absorb the latest public information available. Therefore, it does not allow investors to benefit from exploiting the information. It also disallows investors to benefit from using fundamental or technical analysis tools. Weak efficiencyWeak efficiency represents a market where the prices of commodities reflect the historical information available. Therefore, it does not consider the latest news about the stock. It allows investors to use fundamental analysis to benefit from price differences but does not allow for technical analysis. ConclusionMarket efficiency is a concept that represents a market where commodity prices reflect the latest information available. However, in practice, it may not be achievable. Despite that, market efficiency is a vital concept for the various reasons discussed above. Originally Published Here: What is Market Efficiency? When it comes to investments, two concepts go hand-in-hand, risk and return. It is because both of these are mostly related to and impact each other. Every time an investor includes new investments in their portfolios, they consider the risks and returns on the investment. Therefore, it is crucial to understand what each of these concepts is and what they represent. What is Risk in investment?Risks in investment represent the probability or uncertainty of losses. When investing, investors want to maximize their returns. Therefore, they look for investments that can make the highest amount of profits. However, investments don't only come with profits. There is a chance they might result in losses as well. The possibilities of those losses occurring or realizing represent the risk of the investment. There are many reasons why investors may consider specific investments risky. These reasons may include market conditions, uncertainties, the timing of investment, etc. Therefore, according to the source or type of risk, investors consider different risks for an investment. These may include market risk, liquidity risk, longevity risk, inflation risk, credit risk, etc. What is Return on investment?Returns represent the profits that investors get on their investment, usually annually. Sometimes, returns may also come semi-annually or quarterly. Similar to the risks of an investment, its returns are not predetermined. Therefore, investors use different tools to predict or forecast the returns they will receive on their investments. To do so, they use historical information from their investment. There are various types of returns that investors can get on their investments based on several factors. For example, investors can benefit from capital gains or dividends from investing in stocks. On the other hand, capital gains may not be an option when it comes to returns on bonds or debts. Apart from these, other factors also influence returns, including the risk of investments. How are they related?The relationship between risk and return is straightforward. While both may not be directly proportional, they are closely related. Usually, the higher the risks associated with an investment is, the higher its returns will be as well. Similarly, for lower-risk investments, the returns will also be comparatively lower. As stated above, investors always aim to maximize their returns. However, they also prefer lower risks. Nevertheless, both of them contradict each other. Therefore, investors always try to strike a balance between the two. However, depending on the risk tolerance of investors, they may go to either end. Hence, investors can use other techniques to minimize their risks while also getting a respectable return. The most common way in which investors minimize their risks is through diversification. Diversification does not eliminate specific risk, which relates to each investment. However, it can eliminate systematic risk. Regardless of which technique investors use, there always will be a relationship between risk and returns. ConclusionThere are two factors that investors consider when deciding on additions to their portfolios. These are the risks and returns of the investment. Risks represent the probability of losses on an investment. On the other hand, returns represent the profits that investors will make on their investment. Both of these are highly related to or depend on each other. Originally Published Here: Risk and Return in Investment |
Archives
April 2023
|

 RSS Feed
